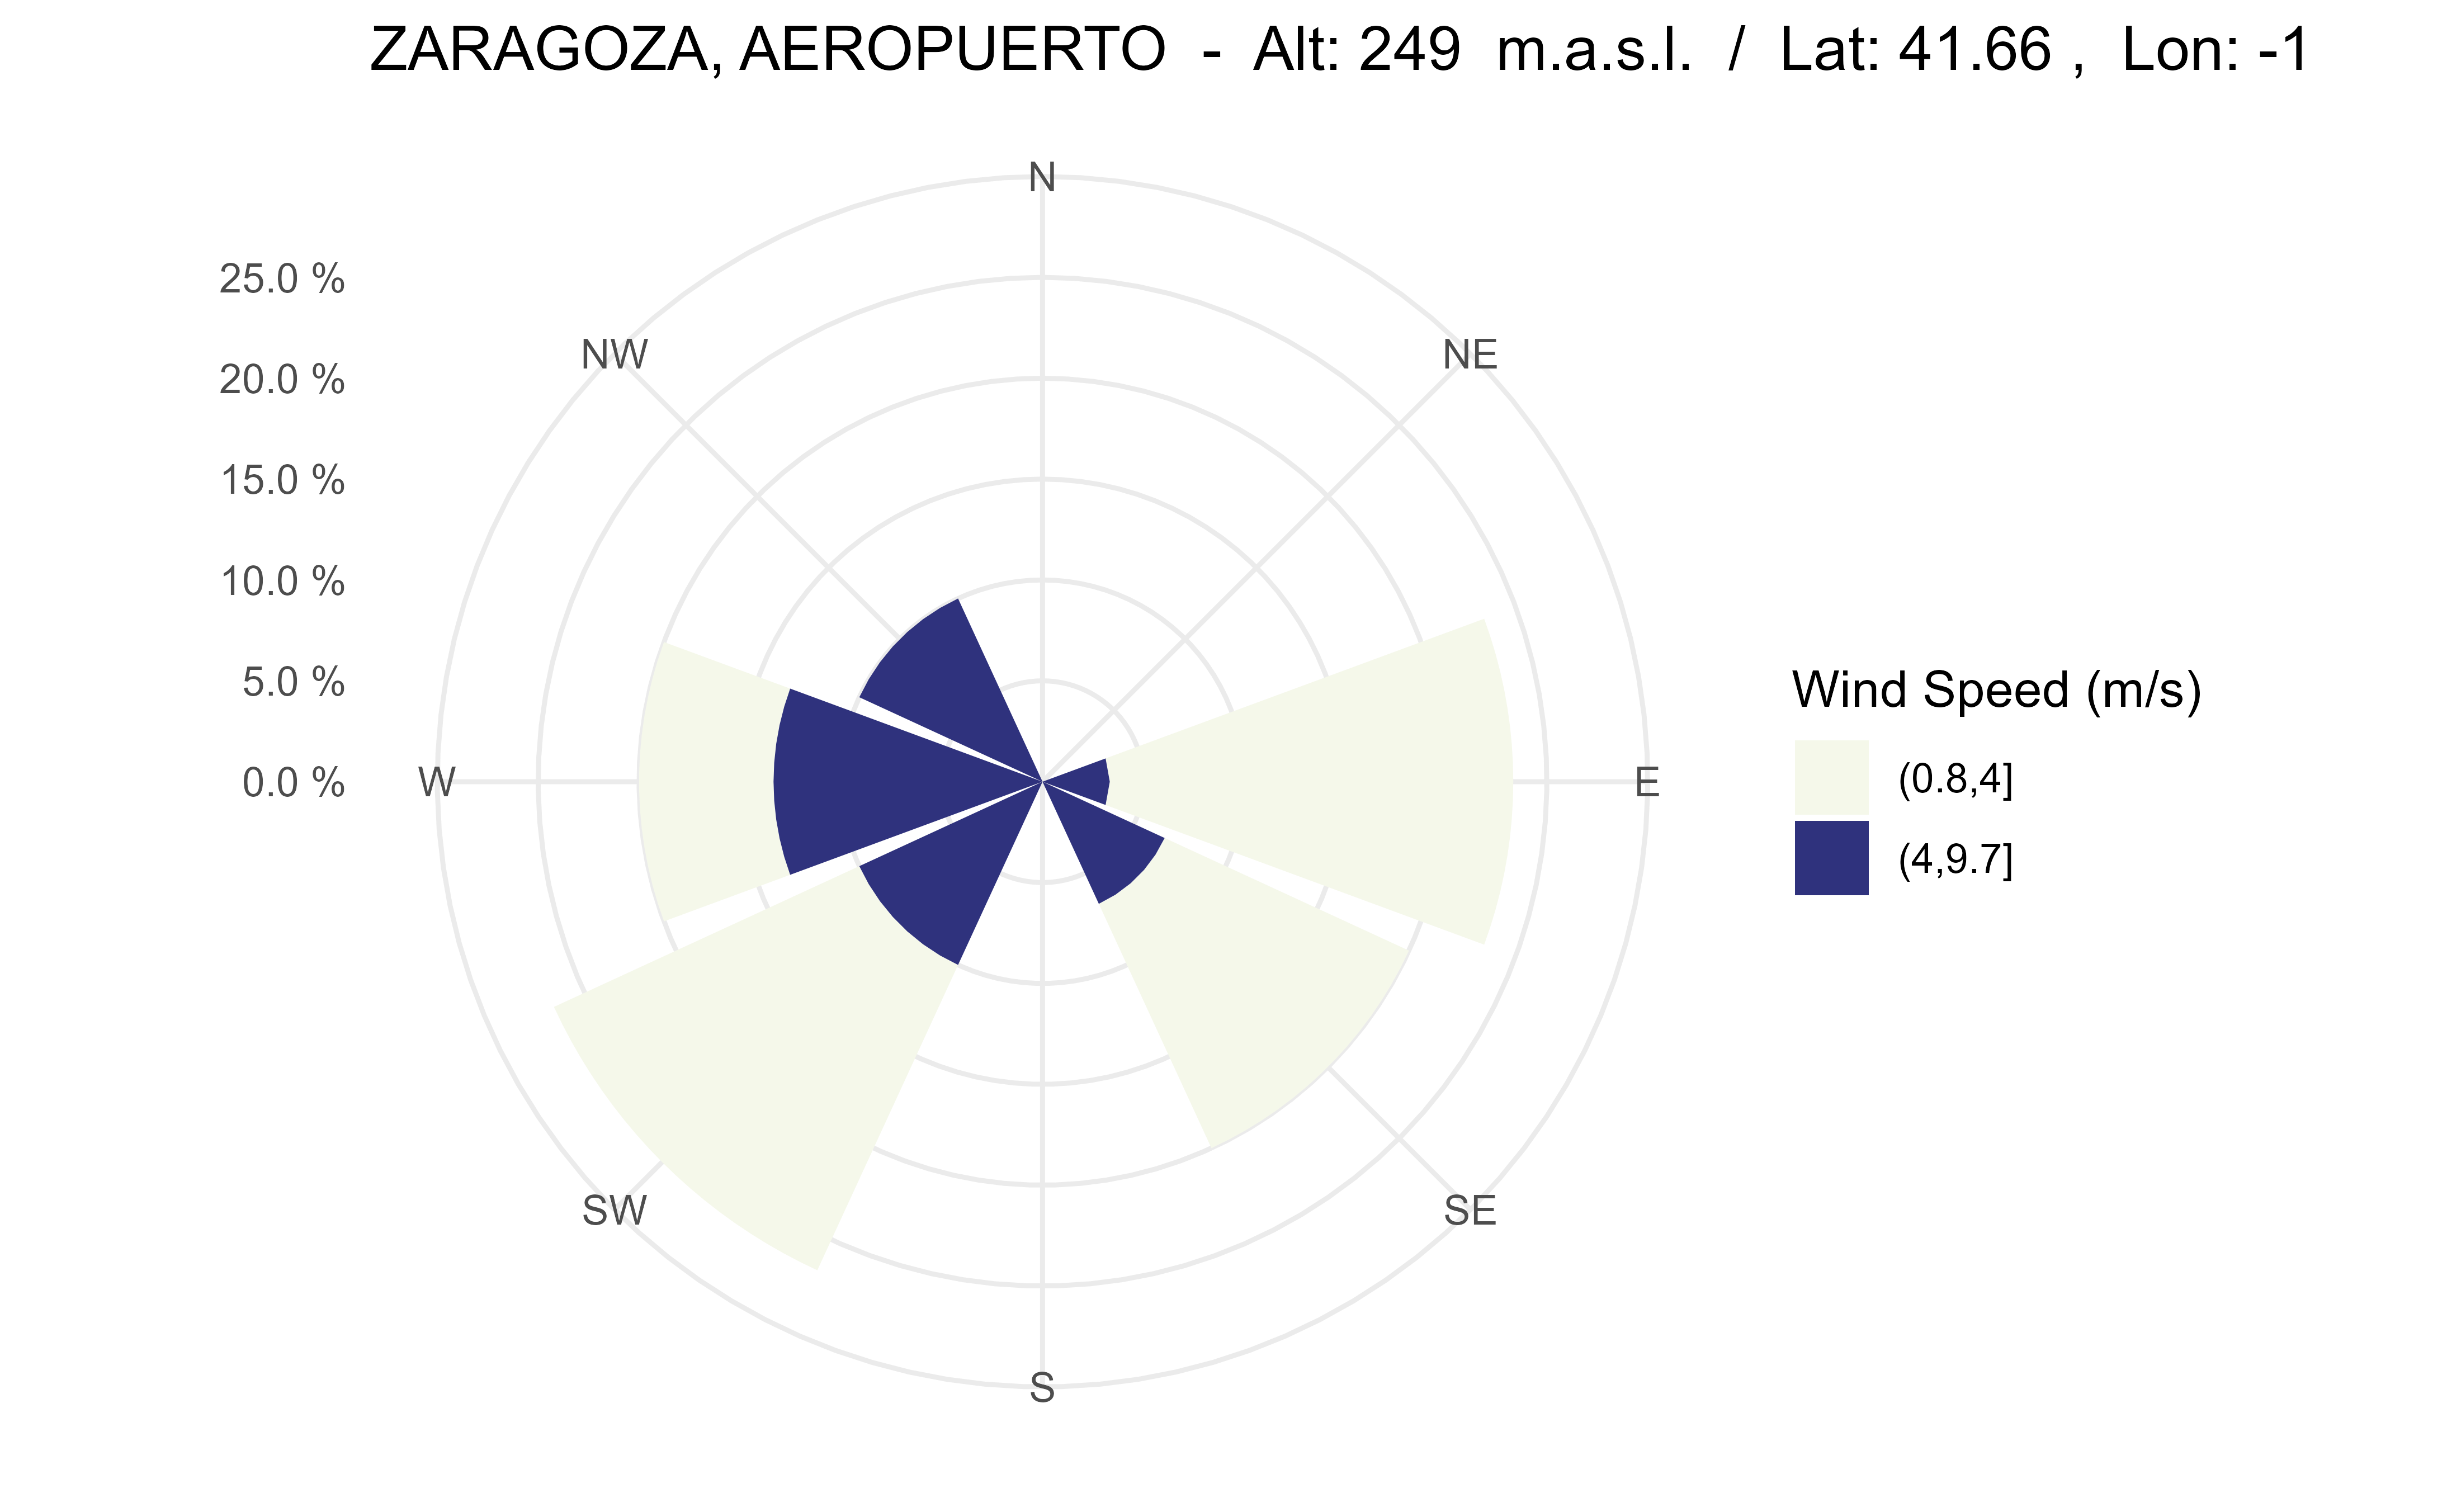
Plots a wind rose showing wind speed and direction at a station over a period of days.
Usage
windrose_days(
  station,
  start = "2000-12-01",
  end = "2000-12-31",
  n_directions = 8,
  n_speeds = 5,
  speed_cuts = NA,
  col_pal = "GnBu",
  calm_wind = 0,
  legend_title = "Wind speed (m/s)",
  verbose = FALSE
)
Arguments
- station
A character vector of station identifiers (see
aemet_stations()) or"all"for all stations.- start
A character string containing the start date in
YYYY-MM-DDformat.- end
A character string containing the end date in
YYYY-MM-DDformat.- n_directions
The number of direction bins (petals) to plot. Valid values are
4,8or16.- n_speeds
The number of equally spaced wind speed bins to plot when
speed_cutsisNA. Defaults to5.- speed_cuts
A numeric vector with the cut points for the wind speed intervals or
NA(default).- col_pal
A character string specifying an
hcl.pals()color palette.- calm_wind
The upper wind speed limit considered calm. Defaults to
0.- legend_title
A character string or expression for the legend title.
- verbose
A logical value. If
TRUE, displays information about the exchange between the client and server.
Value
A ggplot2::ggplot() object.
API key
Queries to the AEMET OpenData API require an API key. Use aemet_api_key()
to set it globally. Query timeout can be controlled with
options(climaemet_timeout = 60) (default value). See
httr2::req_timeout() for details.
See also
aemet_daily_clim()retrieves daily climatology data.climaemet_9434_wind provides example wind observations.
Wind roses:
ggwindrose(),
windrose_period()