Plots a wind rose showing wind speed and direction with ggplot2.
Usage
ggwindrose(
  speed,
  direction,
  n_directions = 8,
  n_speeds = 5,
  speed_cuts = NA,
  col_pal = "GnBu",
  legend_title = "Wind speed (m/s)",
  calm_wind = 0,
  n_col = 1,
  facet = NULL,
  plot_title = "",
  stack_reverse = FALSE,
  ...
)
Arguments
- speed
A numeric vector of wind speeds.
- direction
A numeric vector of wind directions.
- n_directions
The number of direction bins (petals) to plot. Valid values are
4,8or16.- n_speeds
The number of equally spaced wind speed bins to plot when
speed_cutsisNA. Defaults to5.- speed_cuts
A numeric vector with the cut points for the wind speed intervals or
NA(default).- col_pal
A character string specifying an
hcl.pals()color palette.- legend_title
A character string or expression for the legend title.
- calm_wind
The upper wind speed limit considered calm. Defaults to
0.- n_col
The number of plot columns. Defaults to
1.- facet
A character or factor vector of facets used to plot wind roses.
- plot_title
A character string for the plot title.
- stack_reverse
A logical value. If
TRUE, reverses the stack order of speed cuts. See Examples.- ...
Further arguments (ignored).
Value
A ggplot2::ggplot() object.
See also
ggplot2::theme() for additional arguments to pass to
ggwindrose() and climaemet_9434_wind.
Wind roses:
windrose_days(),
windrose_period()
Examples
library(ggplot2)
speed <- climaemet::climaemet_9434_wind$velmedia
direction <- climaemet::climaemet_9434_wind$dir
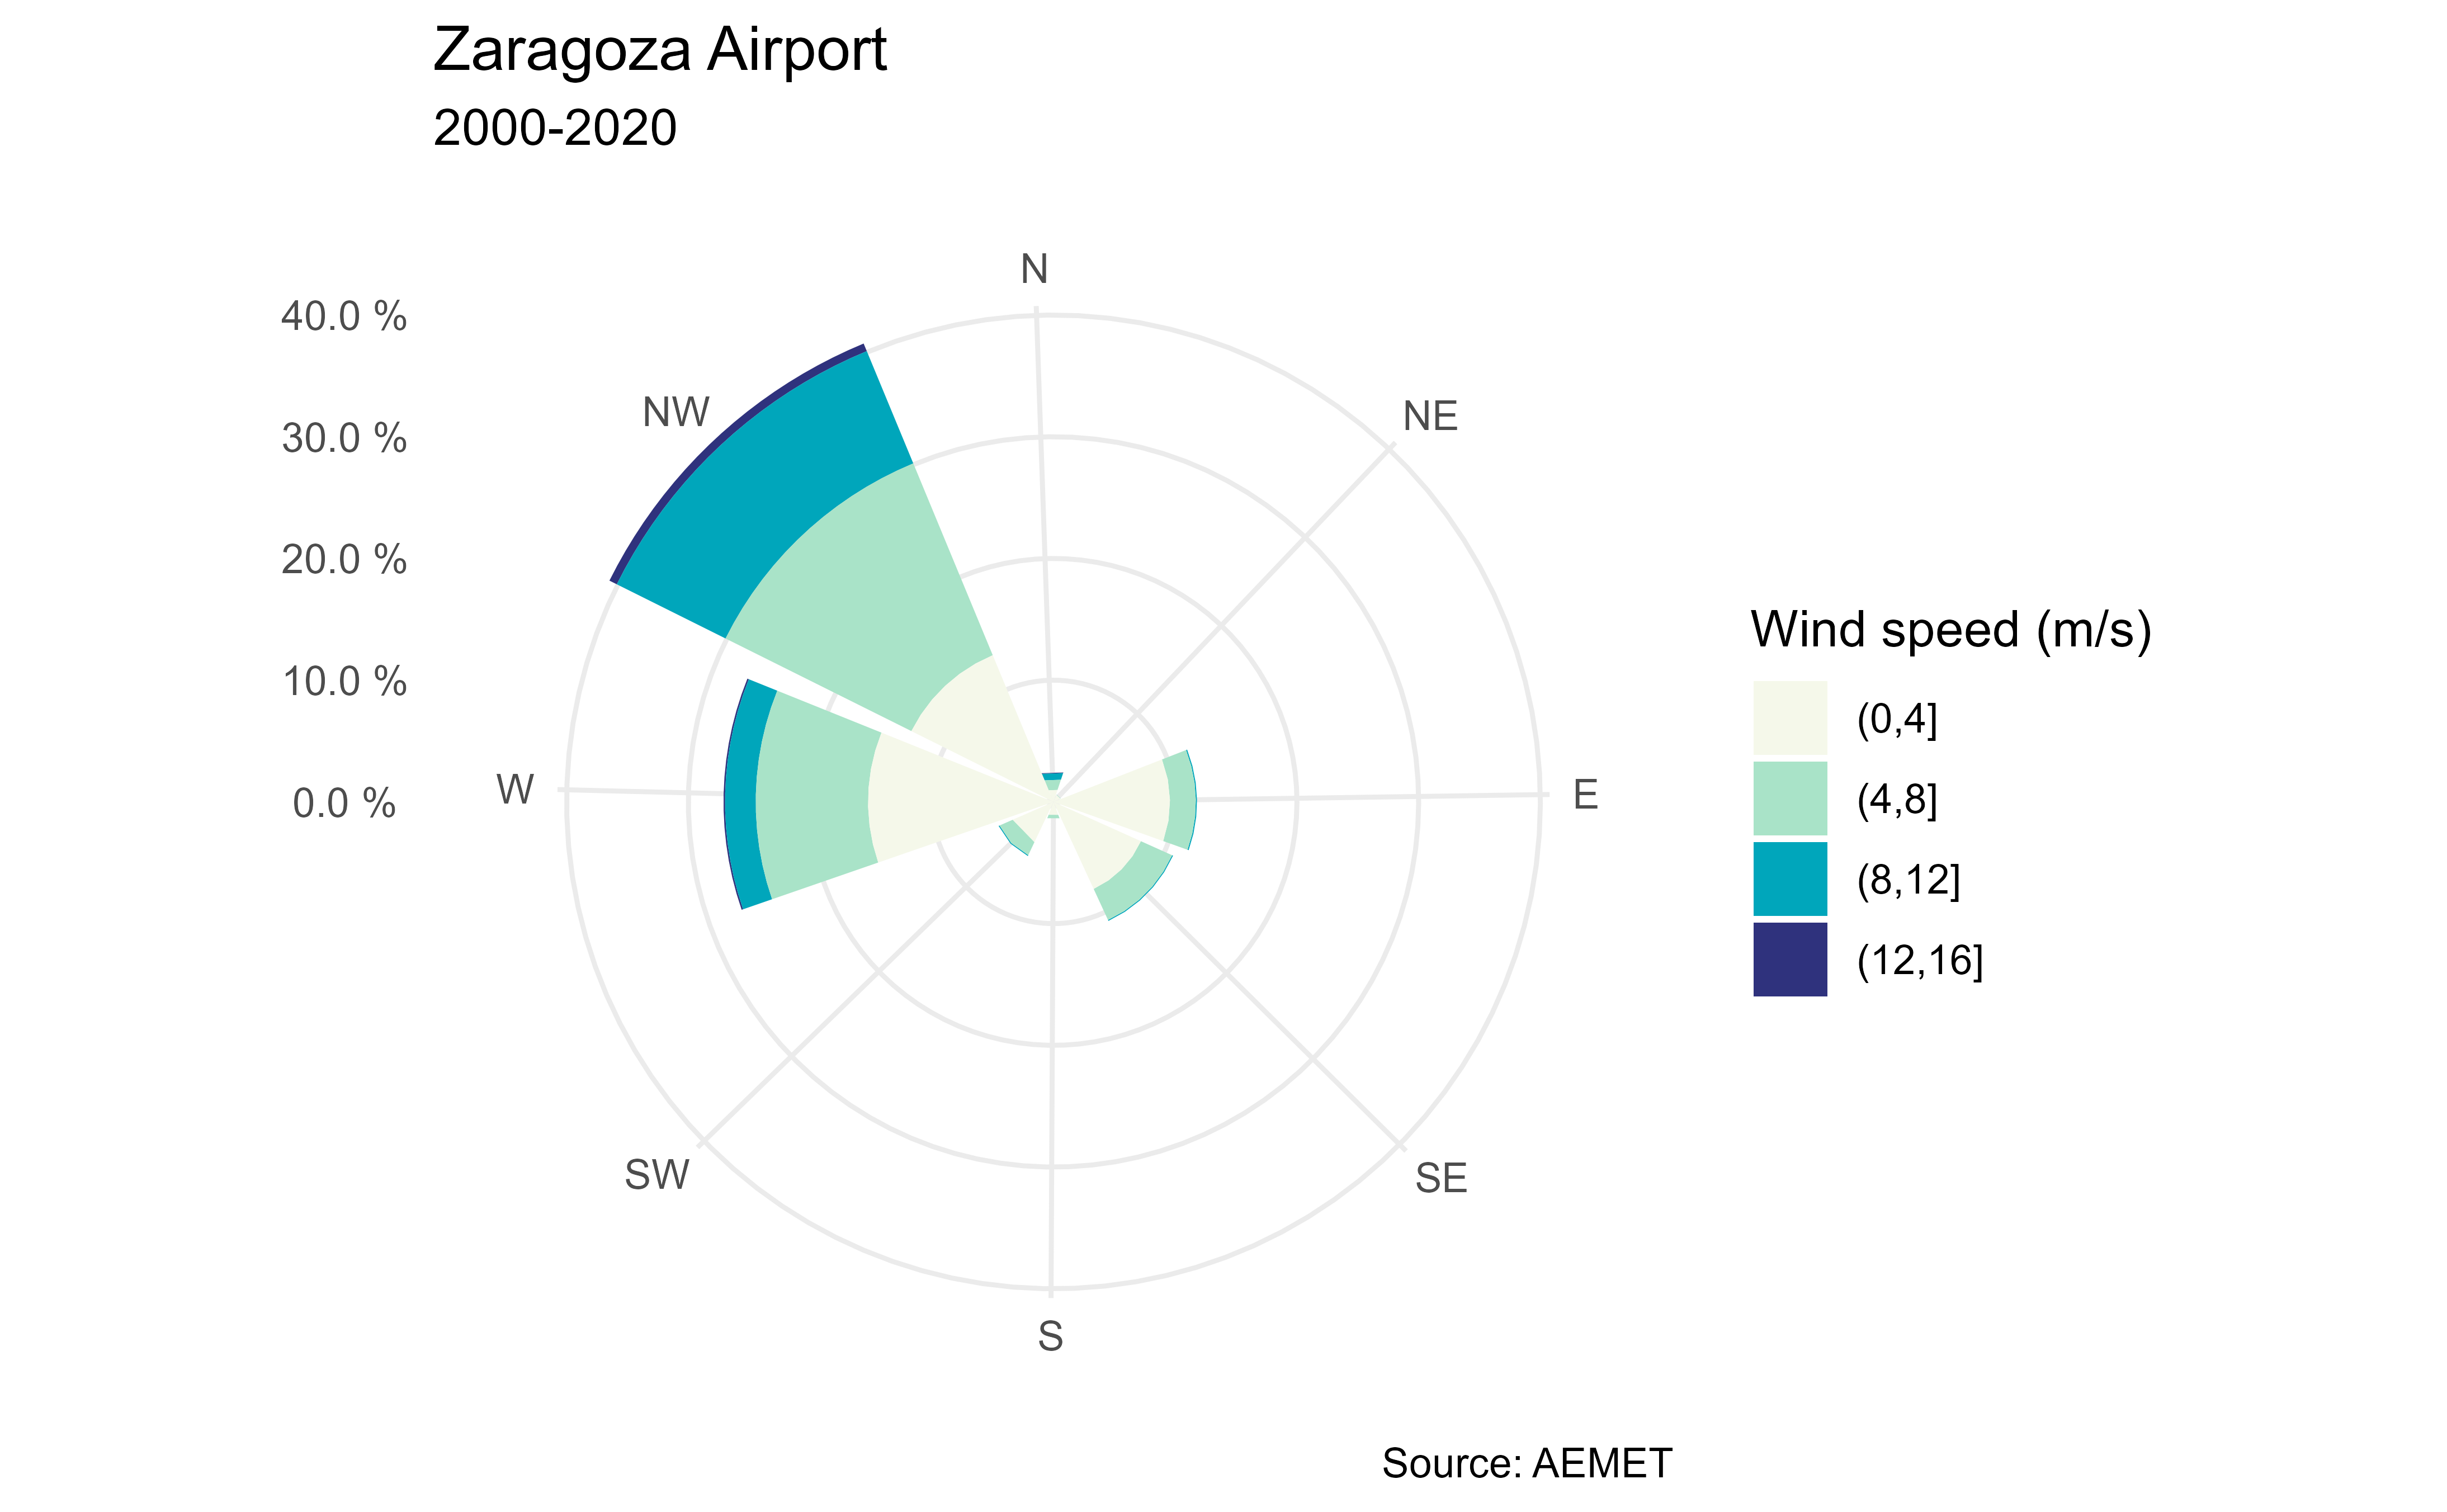
rose <- ggwindrose(
speed = speed,
direction = direction,
speed_cuts = seq(0, 16, 4),
legend_title = "Wind speed (m/s)",
calm_wind = 0,
n_col = 1,
plot_title = "Zaragoza Airport"
)
rose + labs(
subtitle = "2000-2020",
caption = "Source: AEMET"
)
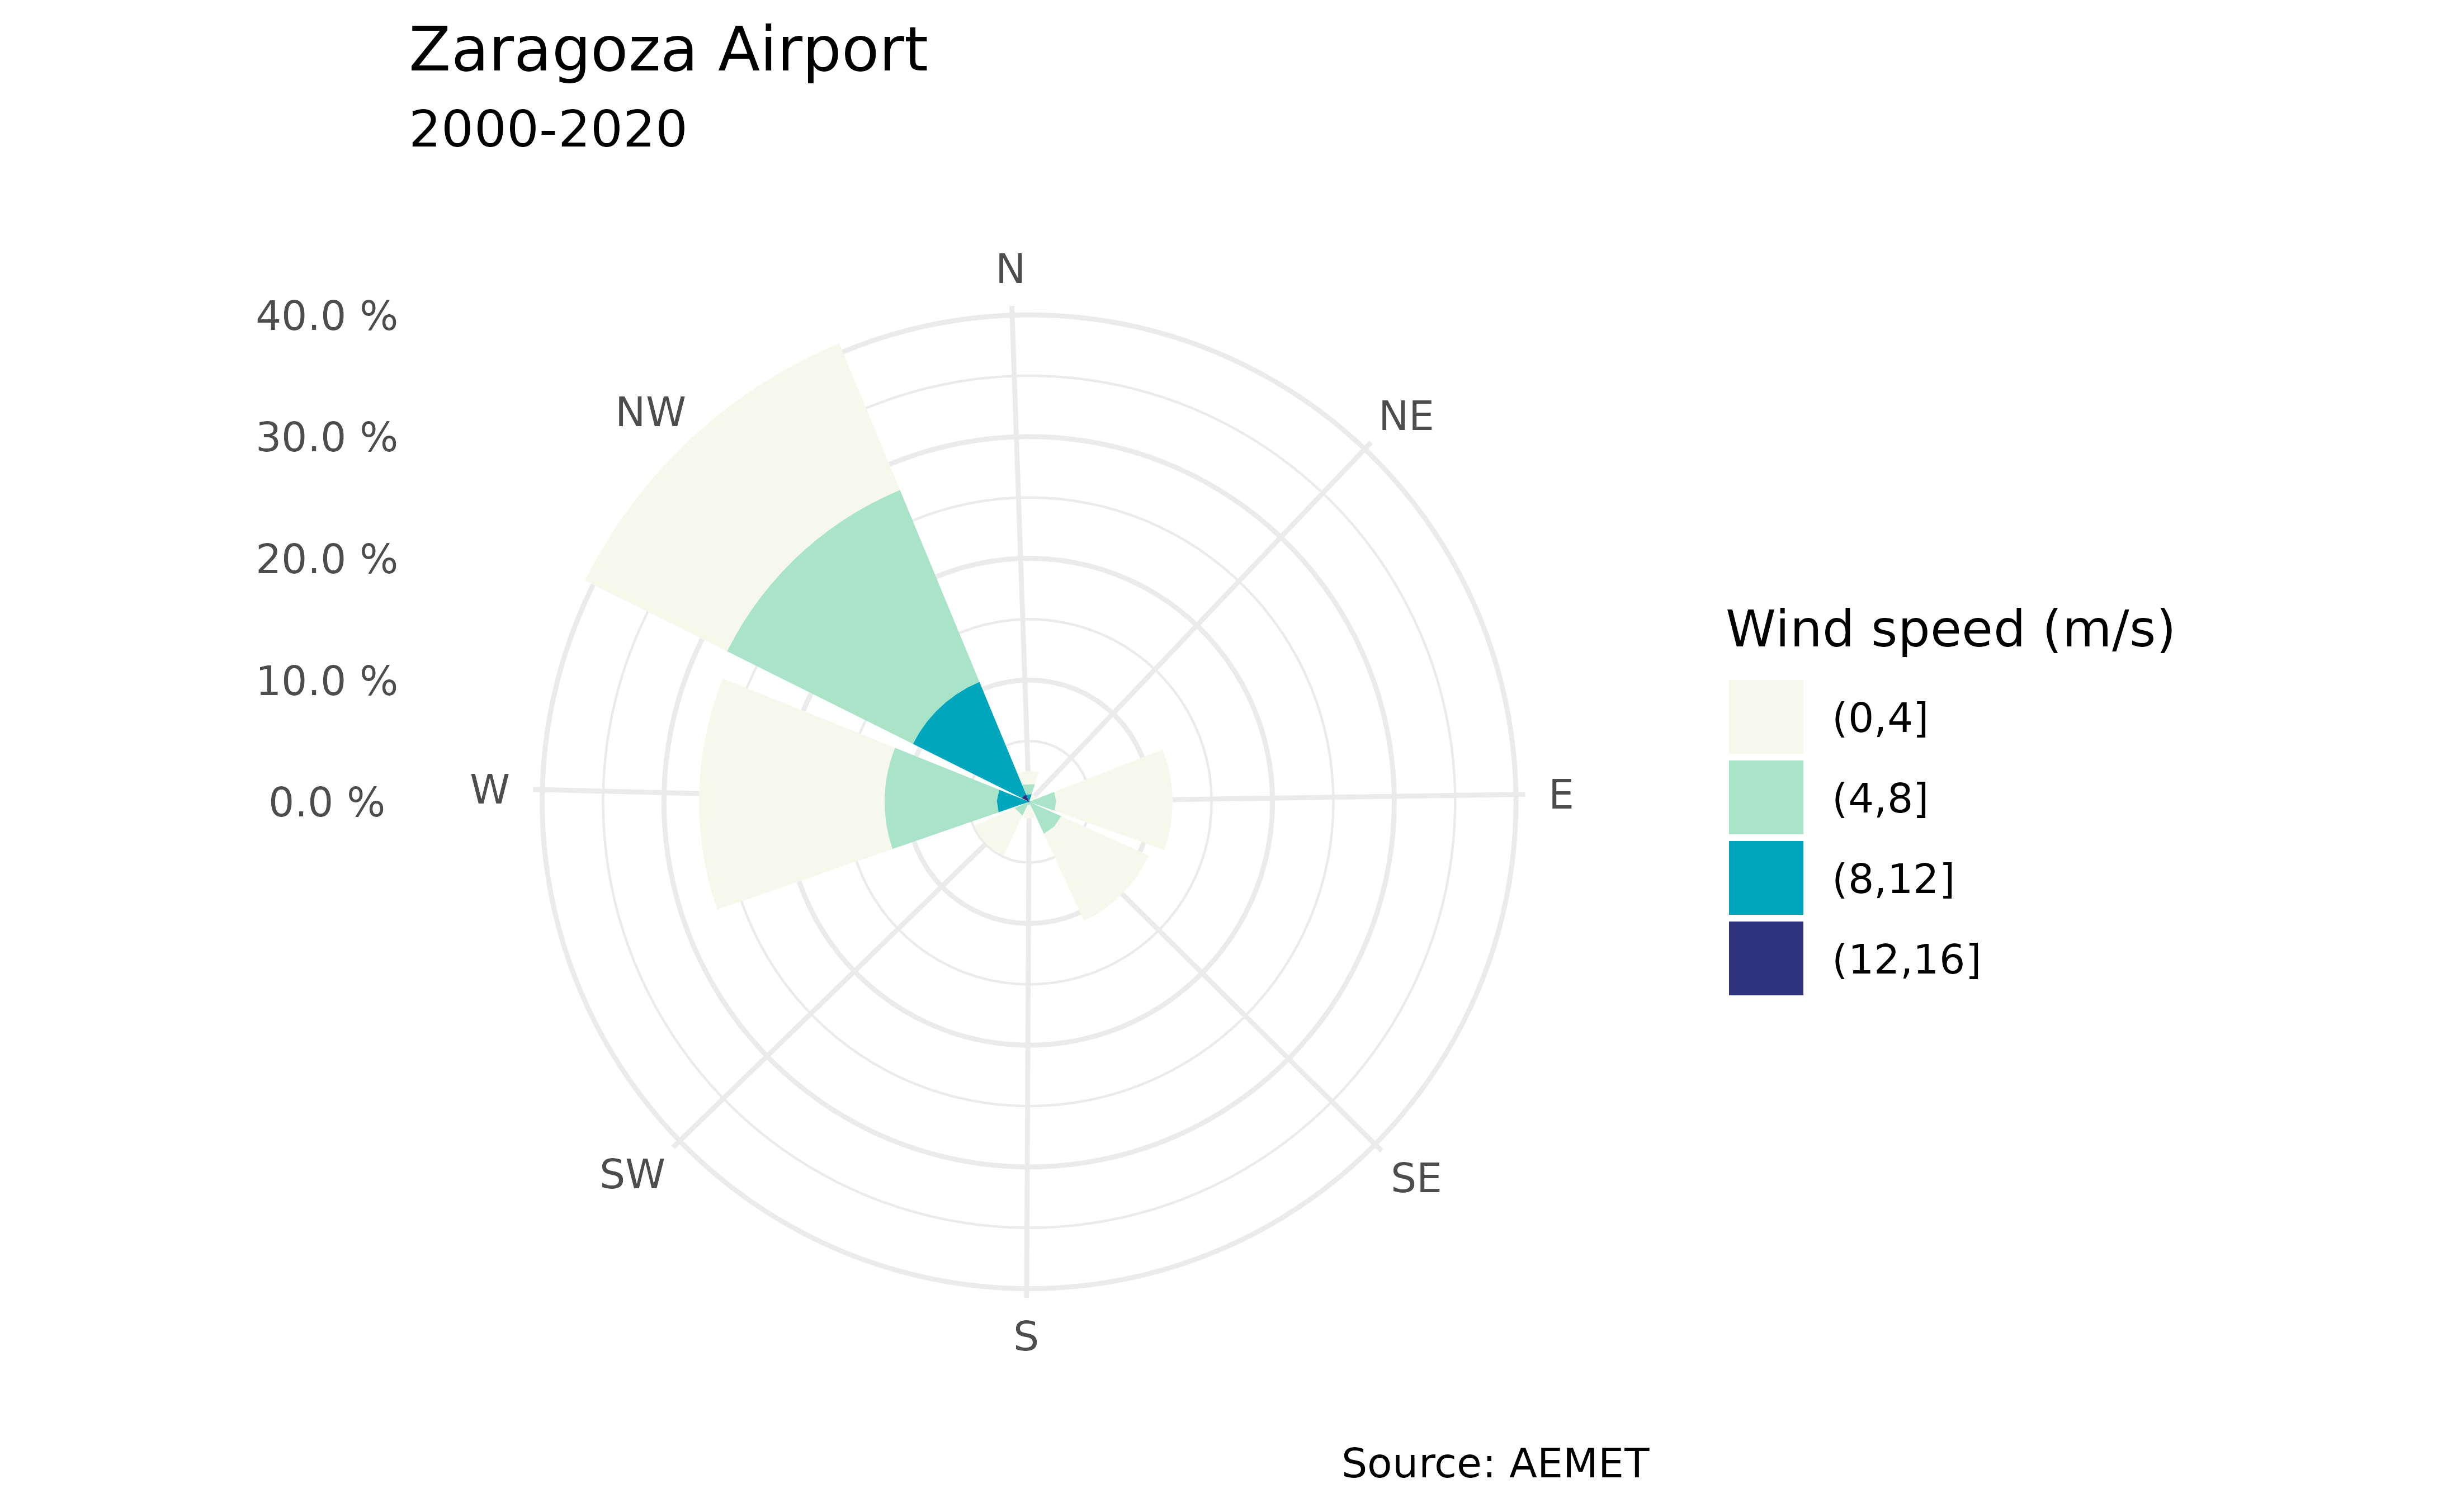 # Reverse the stack.
ggwindrose(
speed = speed,
direction = direction,
speed_cuts = seq(0, 16, 4),
legend_title = "Wind speed (m/s)",
calm_wind = 0,
n_col = 1,
plot_title = "Zaragoza Airport",
stack_reverse = TRUE
) +
labs(
subtitle = "2000-2020",
caption = "Source: AEMET"
)
# Reverse the stack.
ggwindrose(
speed = speed,
direction = direction,
speed_cuts = seq(0, 16, 4),
legend_title = "Wind speed (m/s)",
calm_wind = 0,
n_col = 1,
plot_title = "Zaragoza Airport",
stack_reverse = TRUE
) +
labs(
subtitle = "2000-2020",
caption = "Source: AEMET"
)