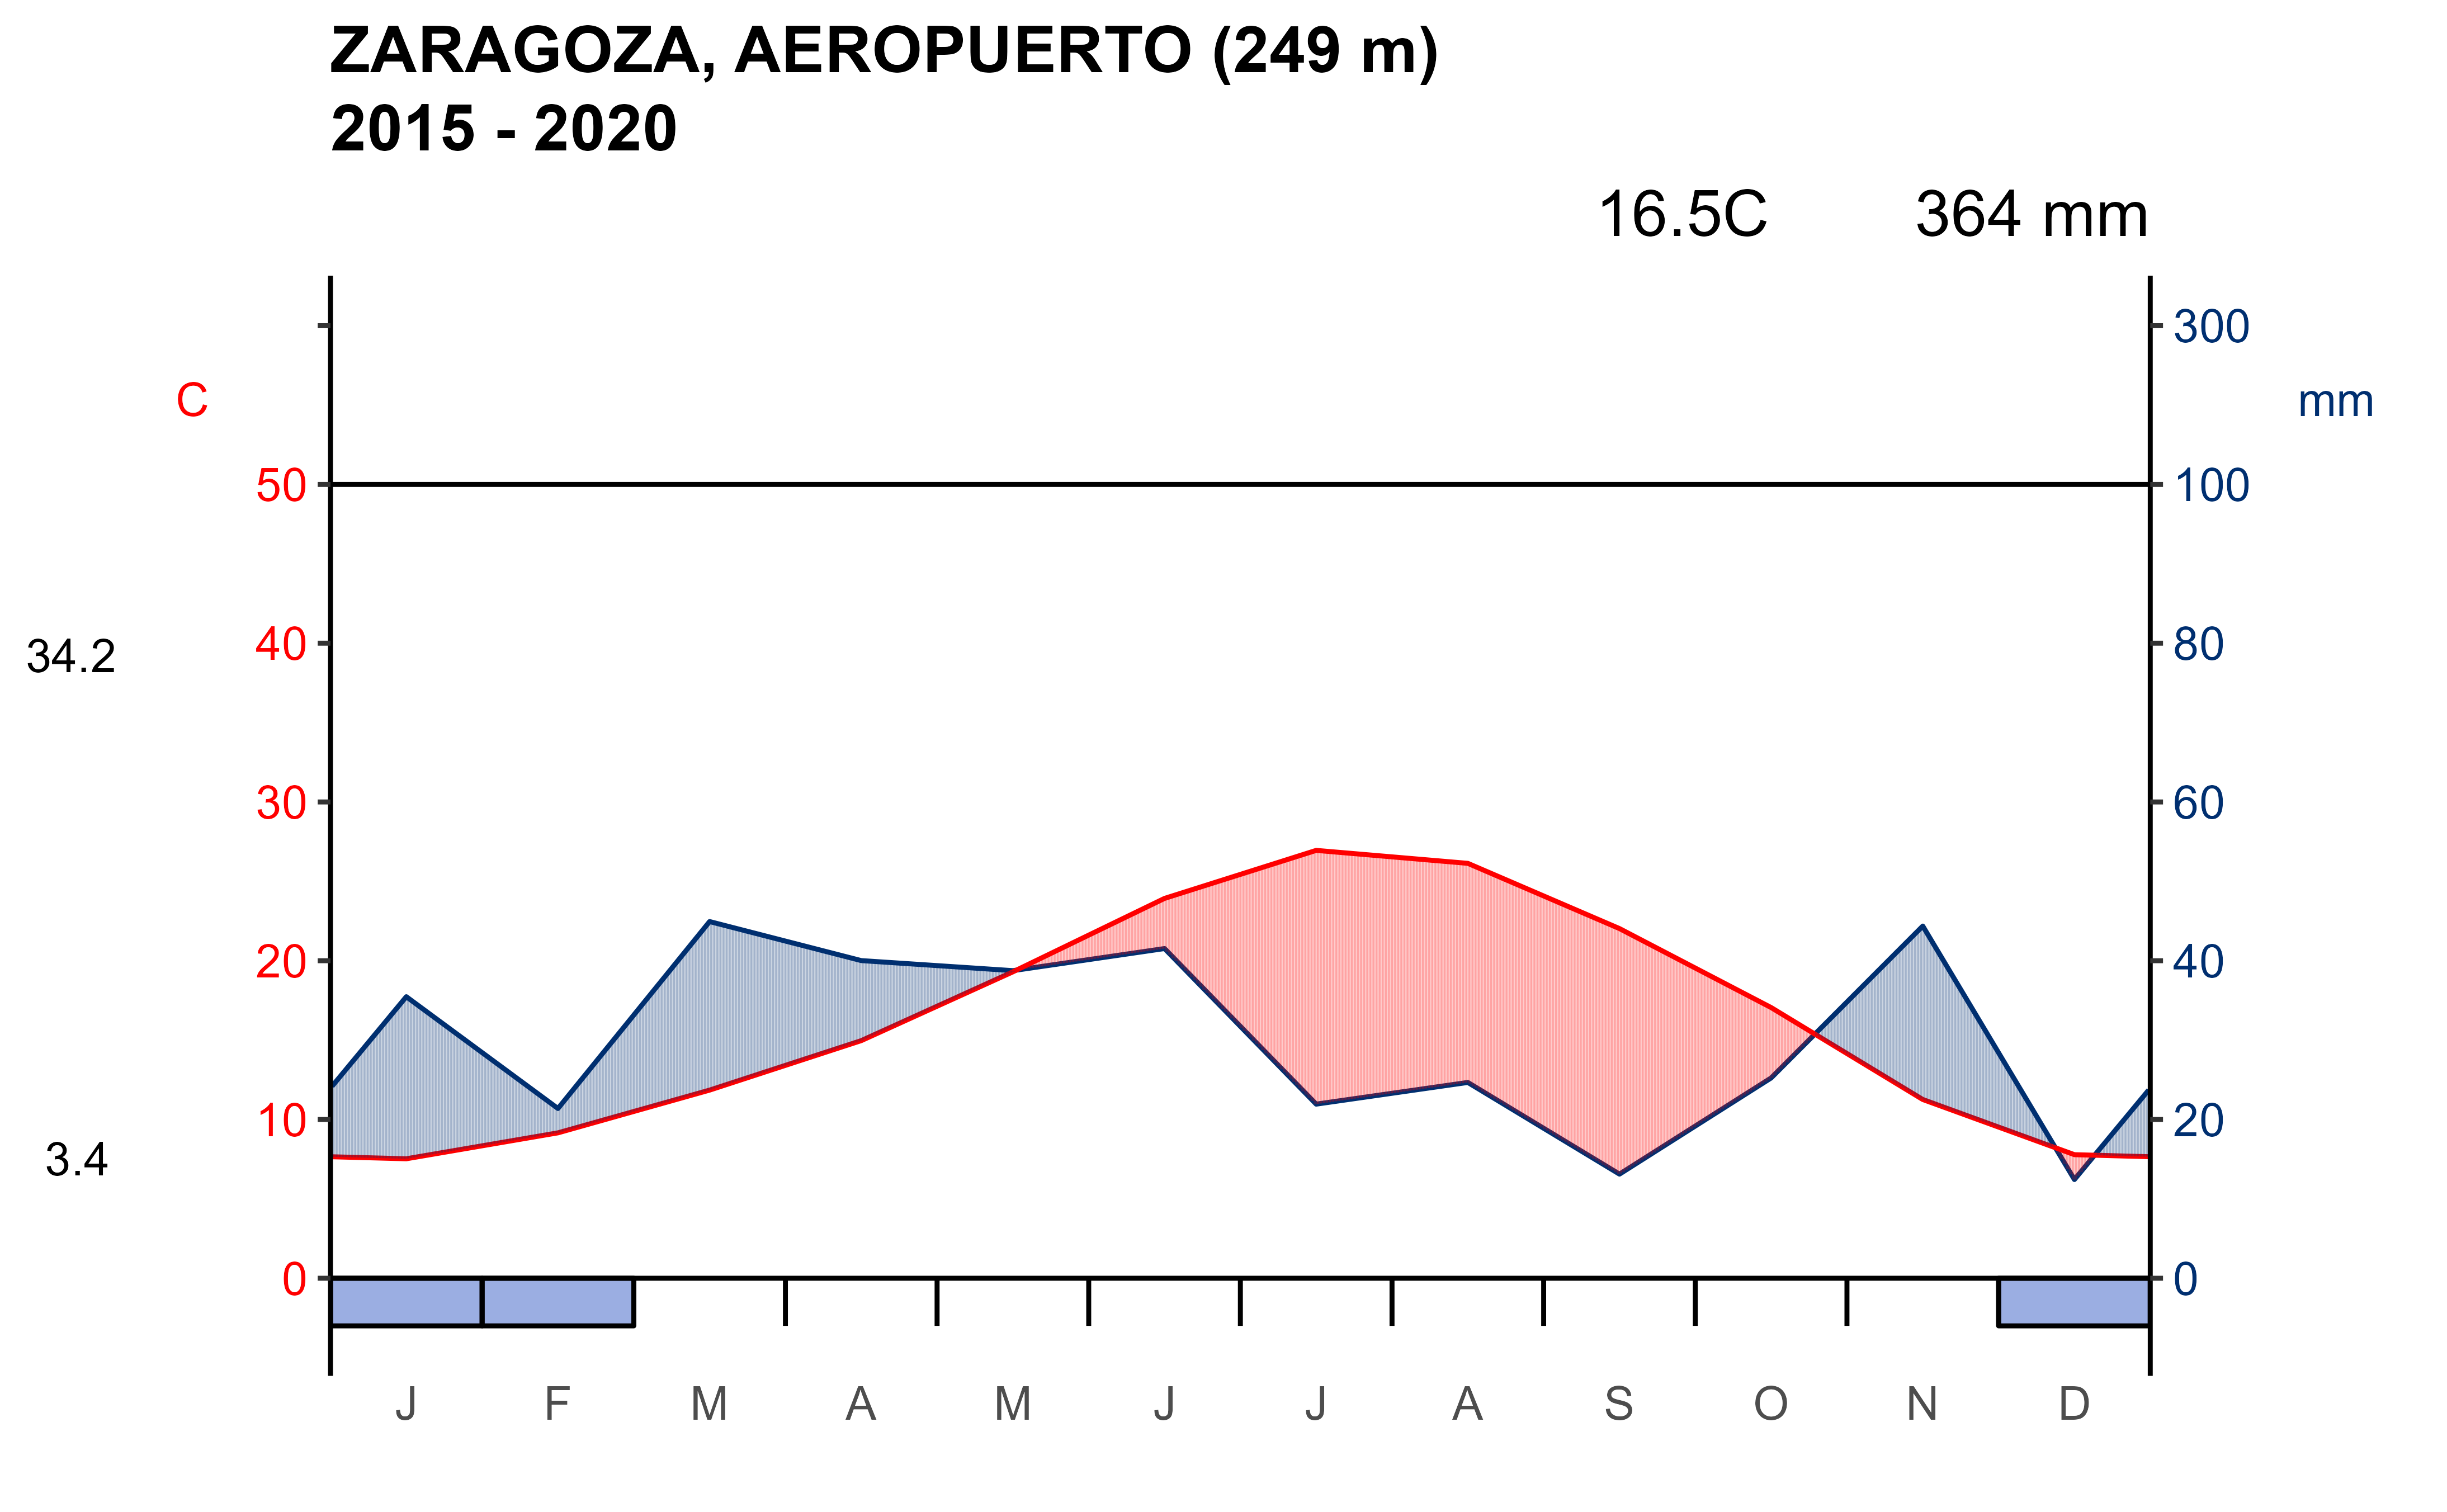
Plots a Walter-Lieth climate diagram from monthly climatology values for a station over a specified time period.
Usage
climatogram_period(
  station = NULL,
  start = 1990,
  end = 2020,
  labels = "en",
  verbose = FALSE,
  ggplot2 = TRUE,
  ...
)
Arguments
- station
A character vector of station identifiers. See
aemet_stations().- start
A numeric value specifying the start year in
YYYYformat.- end
A numeric value specifying the end year in
YYYYformat.- labels
A character string specifying the language for the x-axis month labels, such as
"en"(English),"es"(Spanish) or"fr"(French).- verbose
A logical value. If
TRUE, displays information about the exchange between the client and server.- ggplot2
A logical value. If
TRUE, the function usesggclimat_walter_lieth(). IfFALSE, it usesclimatol::diagwl().- ...
Further arguments passed to
climatol::diagwl()orggclimat_walter_lieth(), depending on the value ofggplot2.
Value
A plot produced by ggclimat_walter_lieth() or
climatol::diagwl(), depending on ggplot2.
API key
Queries to the AEMET OpenData API require an API key. Use aemet_api_key()
to set it globally. Query timeout can be controlled with
options(climaemet_timeout = 60) (default value). See
httr2::req_timeout() for details.
References
Walter H, Lieth H (1967). Klimadiagramm-Weltatlas. VEB Gustav Fischer Verlag, Jena. Published in three installments, 1960-1967, https://hdl.handle.net/2268.1/7079.
Guijarro JA (2026). climatol: Climate Tools (Series Homogenization and Derived Products). doi:10.32614/CRAN.package.climatol . R package version 4.5-0, https://CRAN.R-project.org/package=climatol.
See also
Walter-Lieth climate diagrams:
climatogram_normal(),
ggclimat_walter_lieth()