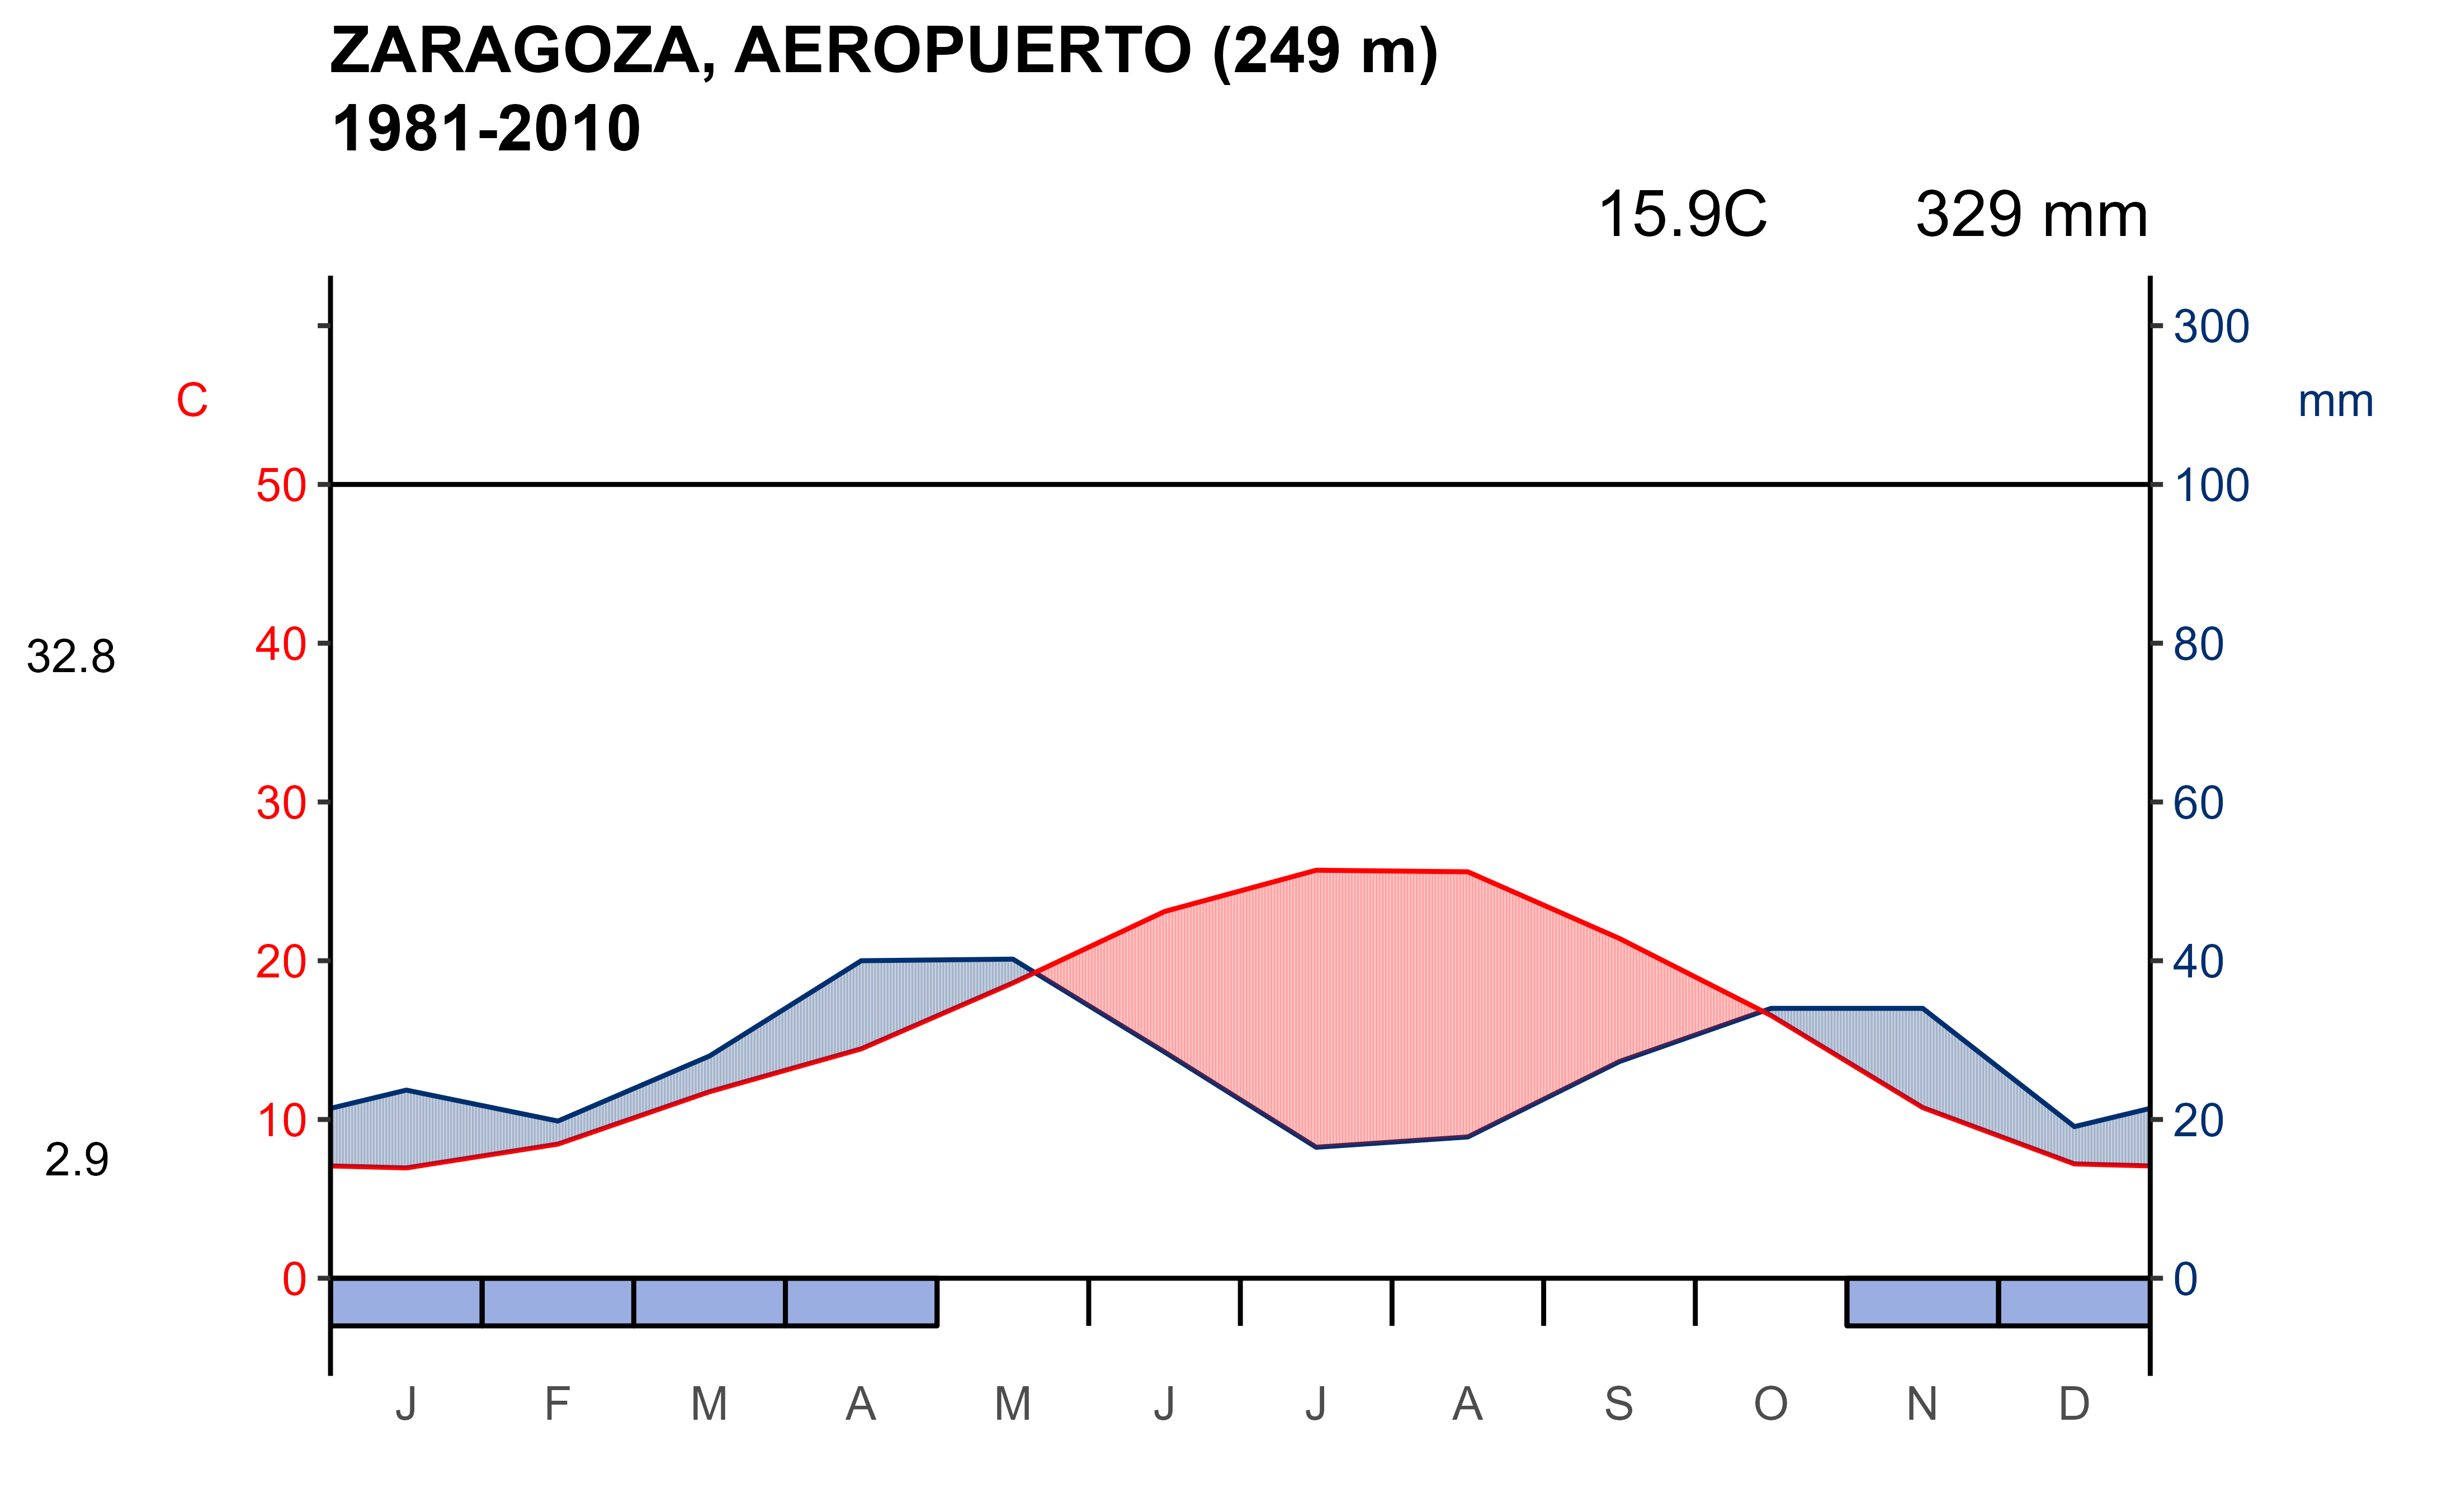
Walter & Lieth climatic diagram from normal climatology values
Source:R/climatogram.R
climatogram_normal.RdPlot of a Walter & Lieth climatic diagram from normal climatology data for a station. This climatogram are great for showing a summary of climate conditions for a place over a time period (1981-2010).
Arguments
- station
Character string with station identifier code(s) (see
aemet_stations()).- labels
Character string as month labels for the X axis:
"en"(english),"es"(spanish),"fr"(french), etc.- verbose
Logical
TRUE/FALSE. Provides information about the flow of information between the client and server.- ggplot2
TRUE/FALSE. OnTRUEthe function usesggclimat_walter_lieth(), ifFALSEusesclimatol::diagwl().- ...
Further arguments to
climatol::diagwl()orggclimat_walter_lieth(), depending on the value of ggplot2.
Note
The code is based on code from the CRAN package climatol.
API Key
You need to set your API Key globally using aemet_api_key().
References
Walter, H. K., Harnickell, E., Lieth, F. H. H., & Rehder, H. (1967). Klimadiagramm-weltatlas. Jena: Fischer, 1967.
Guijarro J. A. (2023). climatol: Climate Tools (Series Homogenization and Derived Products). R package version 4.0.0, https://climatol.eu.
See also
Other aemet_plots:
climatestripes_station(),
climatogram_period(),
ggclimat_walter_lieth(),
ggstripes(),
ggwindrose(),
windrose_days(),
windrose_period()
Other climatogram:
climaemet_9434_climatogram,
climatogram_period(),
ggclimat_walter_lieth()
