Forecast weather in municipalities
Source:R/aemet-forecast-daily.R, R/aemet-forecast-hourly.R
aemet_forecast.RdRetrieves daily or hourly weather forecasts for one or more municipalities.
Usage
aemet_forecast_daily(
  x,
  verbose = FALSE,
  extract_metadata = FALSE,
  progress = TRUE
)

aemet_forecast_hourly(
  x,
  verbose = FALSE,
  extract_metadata = FALSE,
  progress = TRUE
)
Arguments
- x
A character vector of municipality codes to extract. For convenience, climaemet provides these data in the aemet_munic dataset (see
municipiofield) as of January 2025.- verbose
A logical value. If
TRUE, displays information about the exchange between the client and server.- extract_metadata
A logical value. If
TRUE, returns a tibble describing the response fields. Seeget_metadata_aemet().- progress
A logical value. If
TRUE, displays acli::cli_progress_bar()unlessverbose = TRUE.
Value
A nested tibble. Forecast values can be
extracted with aemet_forecast_tidy(). See also Details.
Details
Forecasts provided by the AEMET OpenData API have a complex
structure.
Although climaemet returns a tibble, each
forecast value is provided as a nested tibble.
The aemet_forecast_tidy() helper can unnest these values and provide a
single unnested tibble for the requested variable.
If extract_metadata = TRUE, the function returns a simple
tibble describing each forecast field.
API key
Queries to the AEMET OpenData API require an API key. Use aemet_api_key()
to set it globally. Query timeout can be controlled with
options(climaemet_timeout = 60) (default value). See
httr2::req_timeout() for details.
See also
aemet_munic provides municipality codes.
mapSpain provides
sfobjects of municipalities throughmapSpain::esp_get_munic(). See also Examples.
Forecasts:
aemet_forecast_beaches(),
aemet_forecast_fires(),
aemet_forecast_tidy()
Examples
# Select cities.
data("aemet_munic")
library(dplyr)
munis <- aemet_munic |>
filter(municipio_nombre %in% c("Santiago de Compostela", "Lugo")) |>
pull(municipio)
daily <- aemet_forecast_daily(munis)
# Metadata.
meta <- aemet_forecast_daily(munis, extract_metadata = TRUE)
glimpse(meta$campos)
#> Rows: 23
#> Columns: 5
#> $ id <chr> "id", "version", "elaborado", "nombre", "provincia", "fech…
#> $ descripcion <chr> "Indicativo de municipio", "Versión", "Fecha de elaboració…
#> $ tipo_datos <chr> "string", "float", "dataTime", "string", "string", "date",…
#> $ requerido <lgl> TRUE, TRUE, TRUE, TRUE, TRUE, FALSE, FALSE, FALSE, FALSE, …
#> $ unidad <chr> NA, NA, NA, NA, NA, NA, "Tanto por ciento (%)", "metros (m…
# Variables available.
aemet_forecast_vars_available(daily)
#> [1] "probPrecipitacion" "cotaNieveProv" "estadoCielo"
#> [4] "viento" "rachaMax" "temperatura"
#> [7] "sensTermica" "humedadRelativa"
# This is nested.
daily |>
select(municipio, fecha, nombre, temperatura)
#> # A tibble: 14 × 4
#> municipio fecha nombre temperatura$maxima $minima $dato
#> <chr> <date> <chr> <int> <int> <list>
#> 1 15078 2026-07-18 Santiago de Compostela 27 16 <df>
#> 2 15078 2026-07-19 Santiago de Compostela 29 18 <df>
#> 3 15078 2026-07-20 Santiago de Compostela 28 18 <df>
#> 4 15078 2026-07-21 Santiago de Compostela 29 17 <df>
#> 5 15078 2026-07-22 Santiago de Compostela 29 17 <df>
#> 6 15078 2026-07-23 Santiago de Compostela 28 16 <df>
#> 7 15078 2026-07-24 Santiago de Compostela 24 16 <df>
#> 8 27028 2026-07-18 Lugo 28 16 <df>
#> 9 27028 2026-07-19 Lugo 28 17 <df>
#> 10 27028 2026-07-20 Lugo 28 17 <df>
#> 11 27028 2026-07-21 Lugo 28 16 <df>
#> 12 27028 2026-07-22 Lugo 31 17 <df>
#> 13 27028 2026-07-23 Lugo 31 18 <df>
#> 14 27028 2026-07-24 Lugo 27 15 <df>
# Select and unnest.
daily_temp <- aemet_forecast_tidy(daily, "temperatura")
# This is not nested.
daily_temp
#> # A tibble: 14 × 14
#> elaborado municipio nombre provincia id version uvMax fecha
#> <dttm> <chr> <chr> <chr> <chr> <dbl> <int> <date>
#> 1 2026-07-18 15:29:09 15078 Santi… A Coruña 15078 1 8 2026-07-18
#> 2 2026-07-18 15:29:09 15078 Santi… A Coruña 15078 1 8 2026-07-19
#> 3 2026-07-18 15:29:09 15078 Santi… A Coruña 15078 1 7 2026-07-20
#> 4 2026-07-18 15:29:09 15078 Santi… A Coruña 15078 1 8 2026-07-21
#> 5 2026-07-18 15:29:09 15078 Santi… A Coruña 15078 1 8 2026-07-22
#> 6 2026-07-18 15:29:09 15078 Santi… A Coruña 15078 1 NA 2026-07-23
#> 7 2026-07-18 15:29:09 15078 Santi… A Coruña 15078 1 NA 2026-07-24
#> 8 2026-07-18 15:29:09 27028 Lugo Lugo 27028 1 8 2026-07-18
#> 9 2026-07-18 15:29:09 27028 Lugo Lugo 27028 1 8 2026-07-19
#> 10 2026-07-18 15:29:09 27028 Lugo Lugo 27028 1 8 2026-07-20
#> 11 2026-07-18 15:29:09 27028 Lugo Lugo 27028 1 8 2026-07-21
#> 12 2026-07-18 15:29:09 27028 Lugo Lugo 27028 1 8 2026-07-22
#> 13 2026-07-18 15:29:09 27028 Lugo Lugo 27028 1 NA 2026-07-23
#> 14 2026-07-18 15:29:09 27028 Lugo Lugo 27028 1 NA 2026-07-24
#> # ℹ 6 more variables: temperatura_maxima <int>, temperatura_minima <int>,
#> # temperatura_6 <int>, temperatura_12 <int>, temperatura_18 <int>,
#> # temperatura_24 <int>
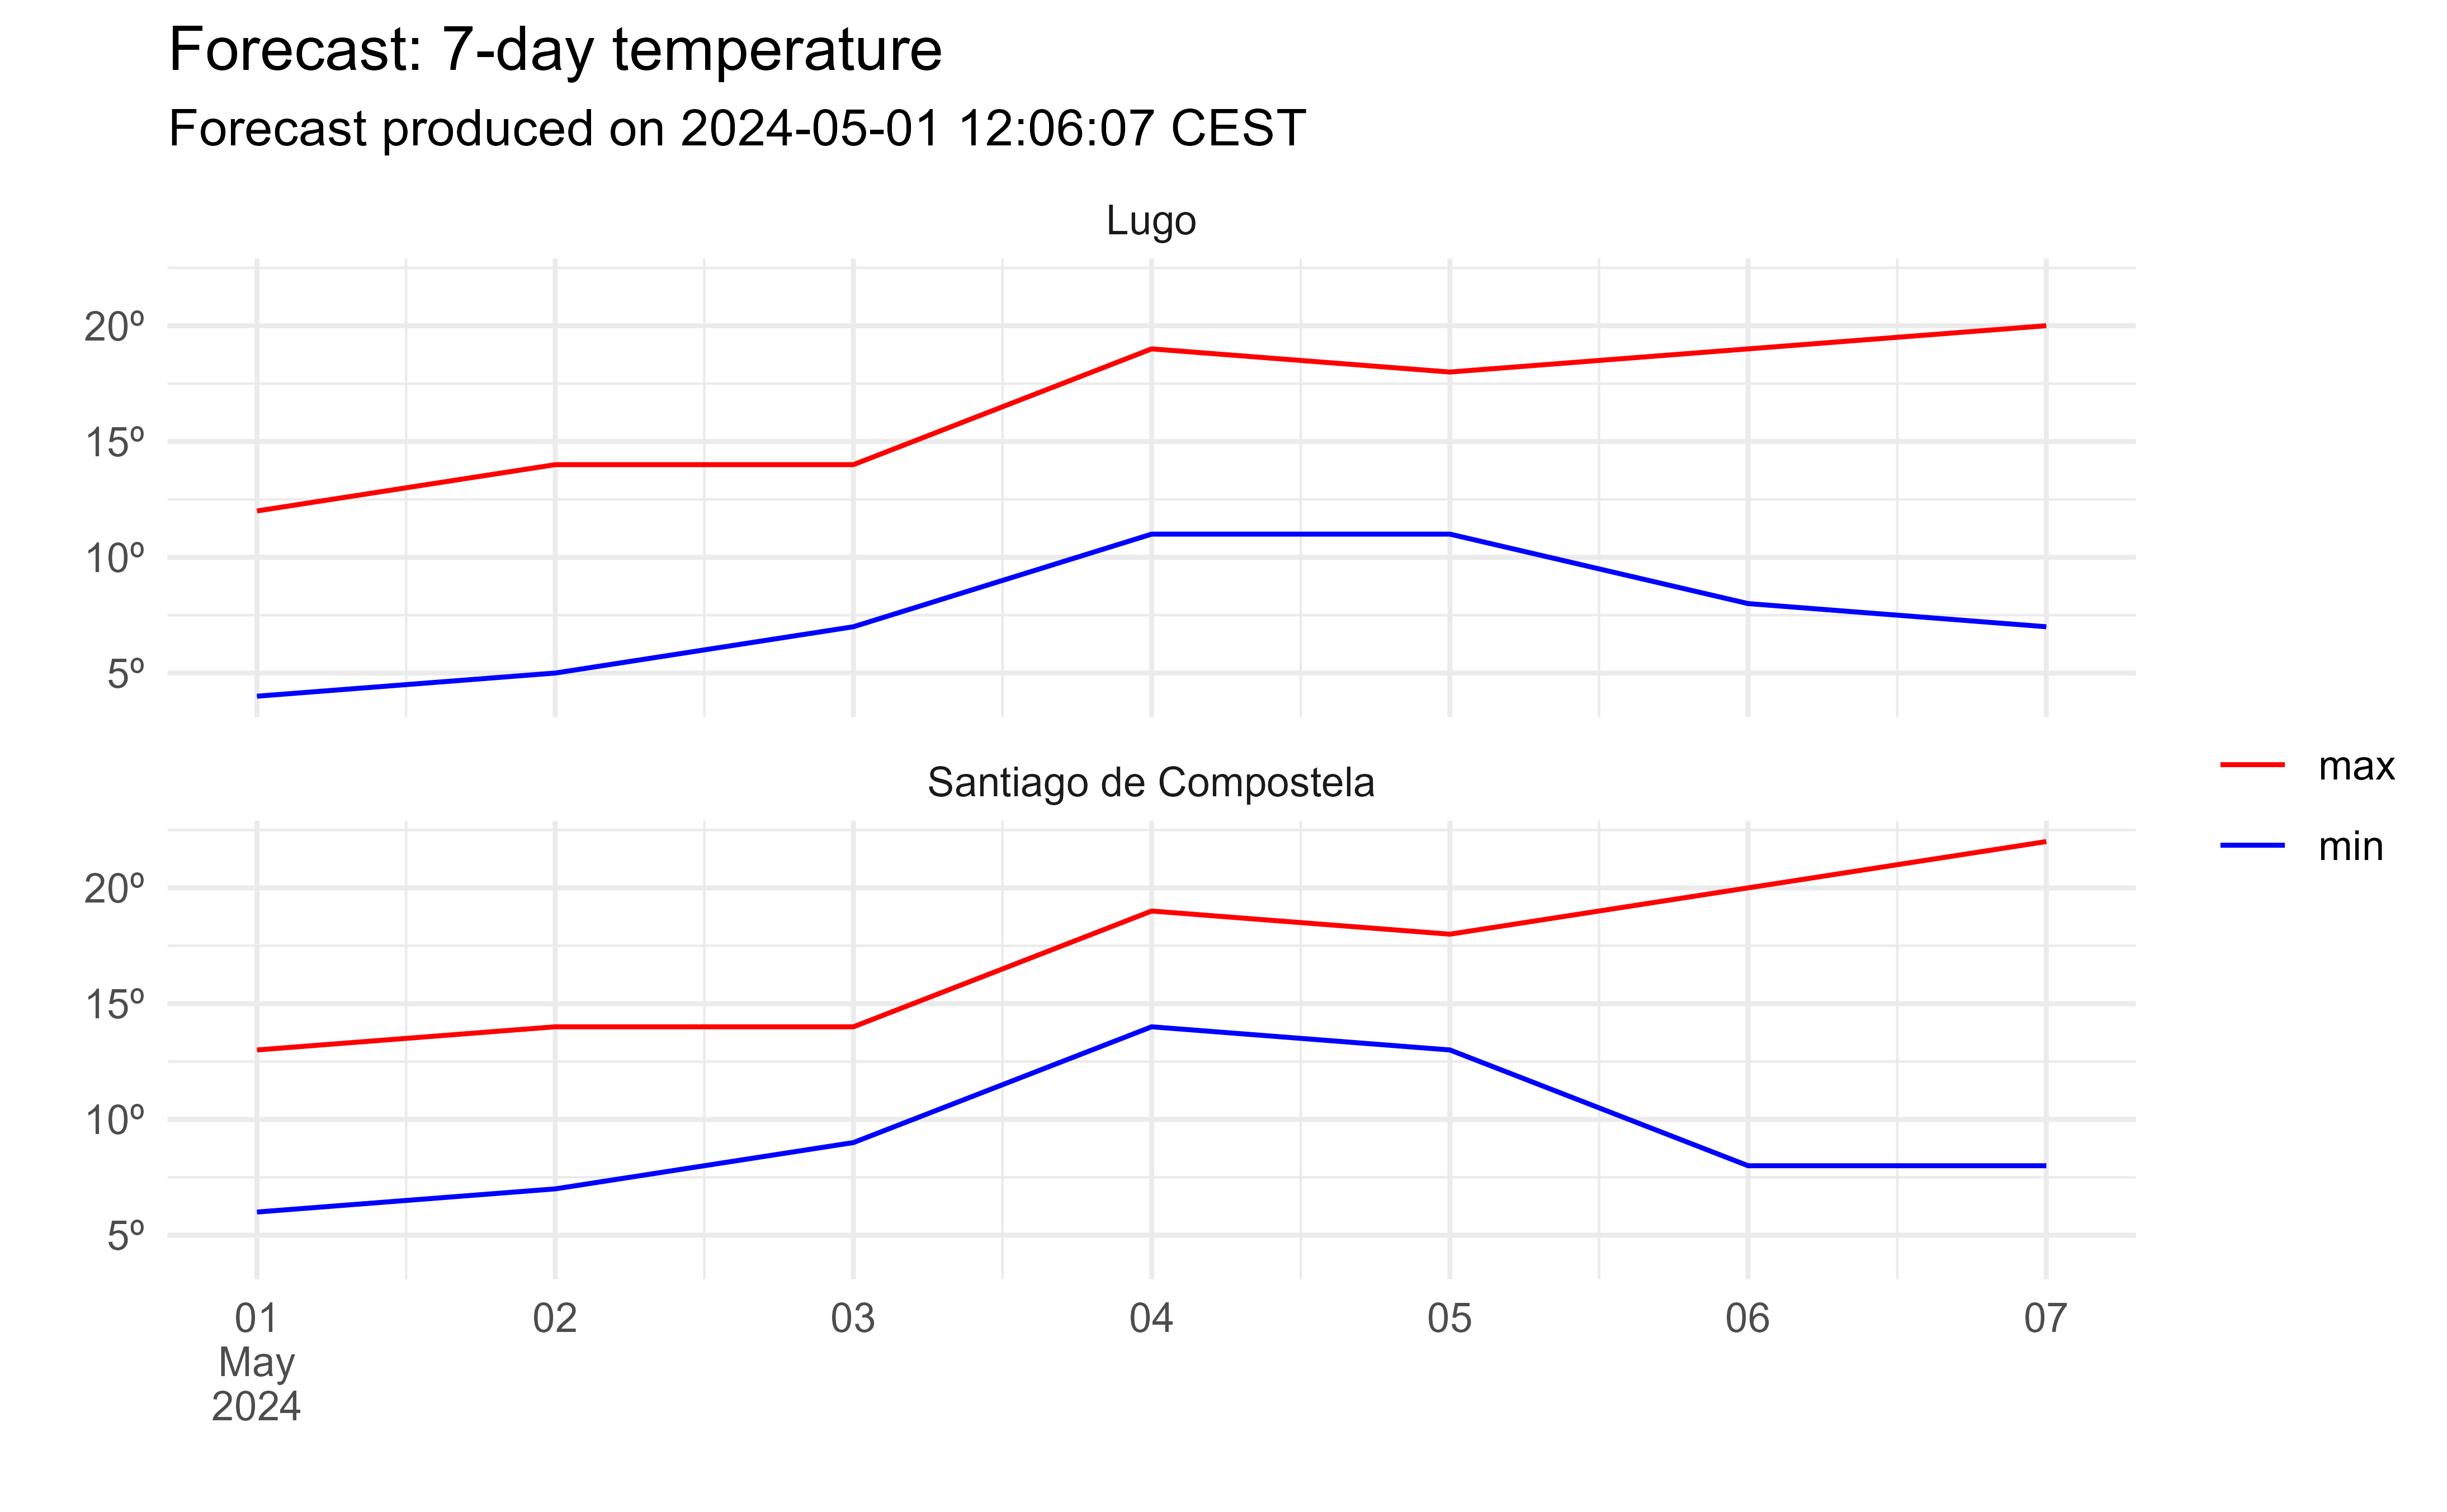
# Wrangle and plot.
daily_temp_end <- daily_temp |>
select(
elaborado, fecha, municipio, nombre, temperatura_minima,
temperatura_maxima
) |>
tidyr::pivot_longer(cols = contains("temperatura"))
# Plot.
library(ggplot2)
ggplot(daily_temp_end) +
geom_line(aes(fecha, value, color = name)) +
facet_wrap(~nombre, ncol = 1) +
scale_color_manual(
values = c("red", "blue"),
labels = c("max", "min")
) +
scale_x_date(
labels = scales::label_date_short(),
breaks = "day"
) +
scale_y_continuous(
labels = scales::label_comma(suffix = "º")
) +
theme_minimal() +
labs(
x = "", y = "",
color = "",
title = "Forecast: 7-day temperature",
subtitle = paste(
"Forecast produced on",
format(daily_temp_end$elaborado[1], usetz = TRUE)
)
)
 # Spatial data.
library(mapSpain)
library(sf)
#> Linking to GEOS 3.12.1, GDAL 3.8.4, PROJ 9.4.0; sf_use_s2() is TRUE
lugo_sf <- esp_get_munic(munic = "Lugo") |>
select(LAU_CODE)
#> ! The file to download is "74.6 Mb".
daily_temp_end_lugo_sf <- daily_temp_end |>
filter(nombre == "Lugo" & name == "temperatura_maxima") |>
# Join by LAU_CODE.
left_join(lugo_sf, by = c("municipio" = "LAU_CODE")) |>
st_as_sf()
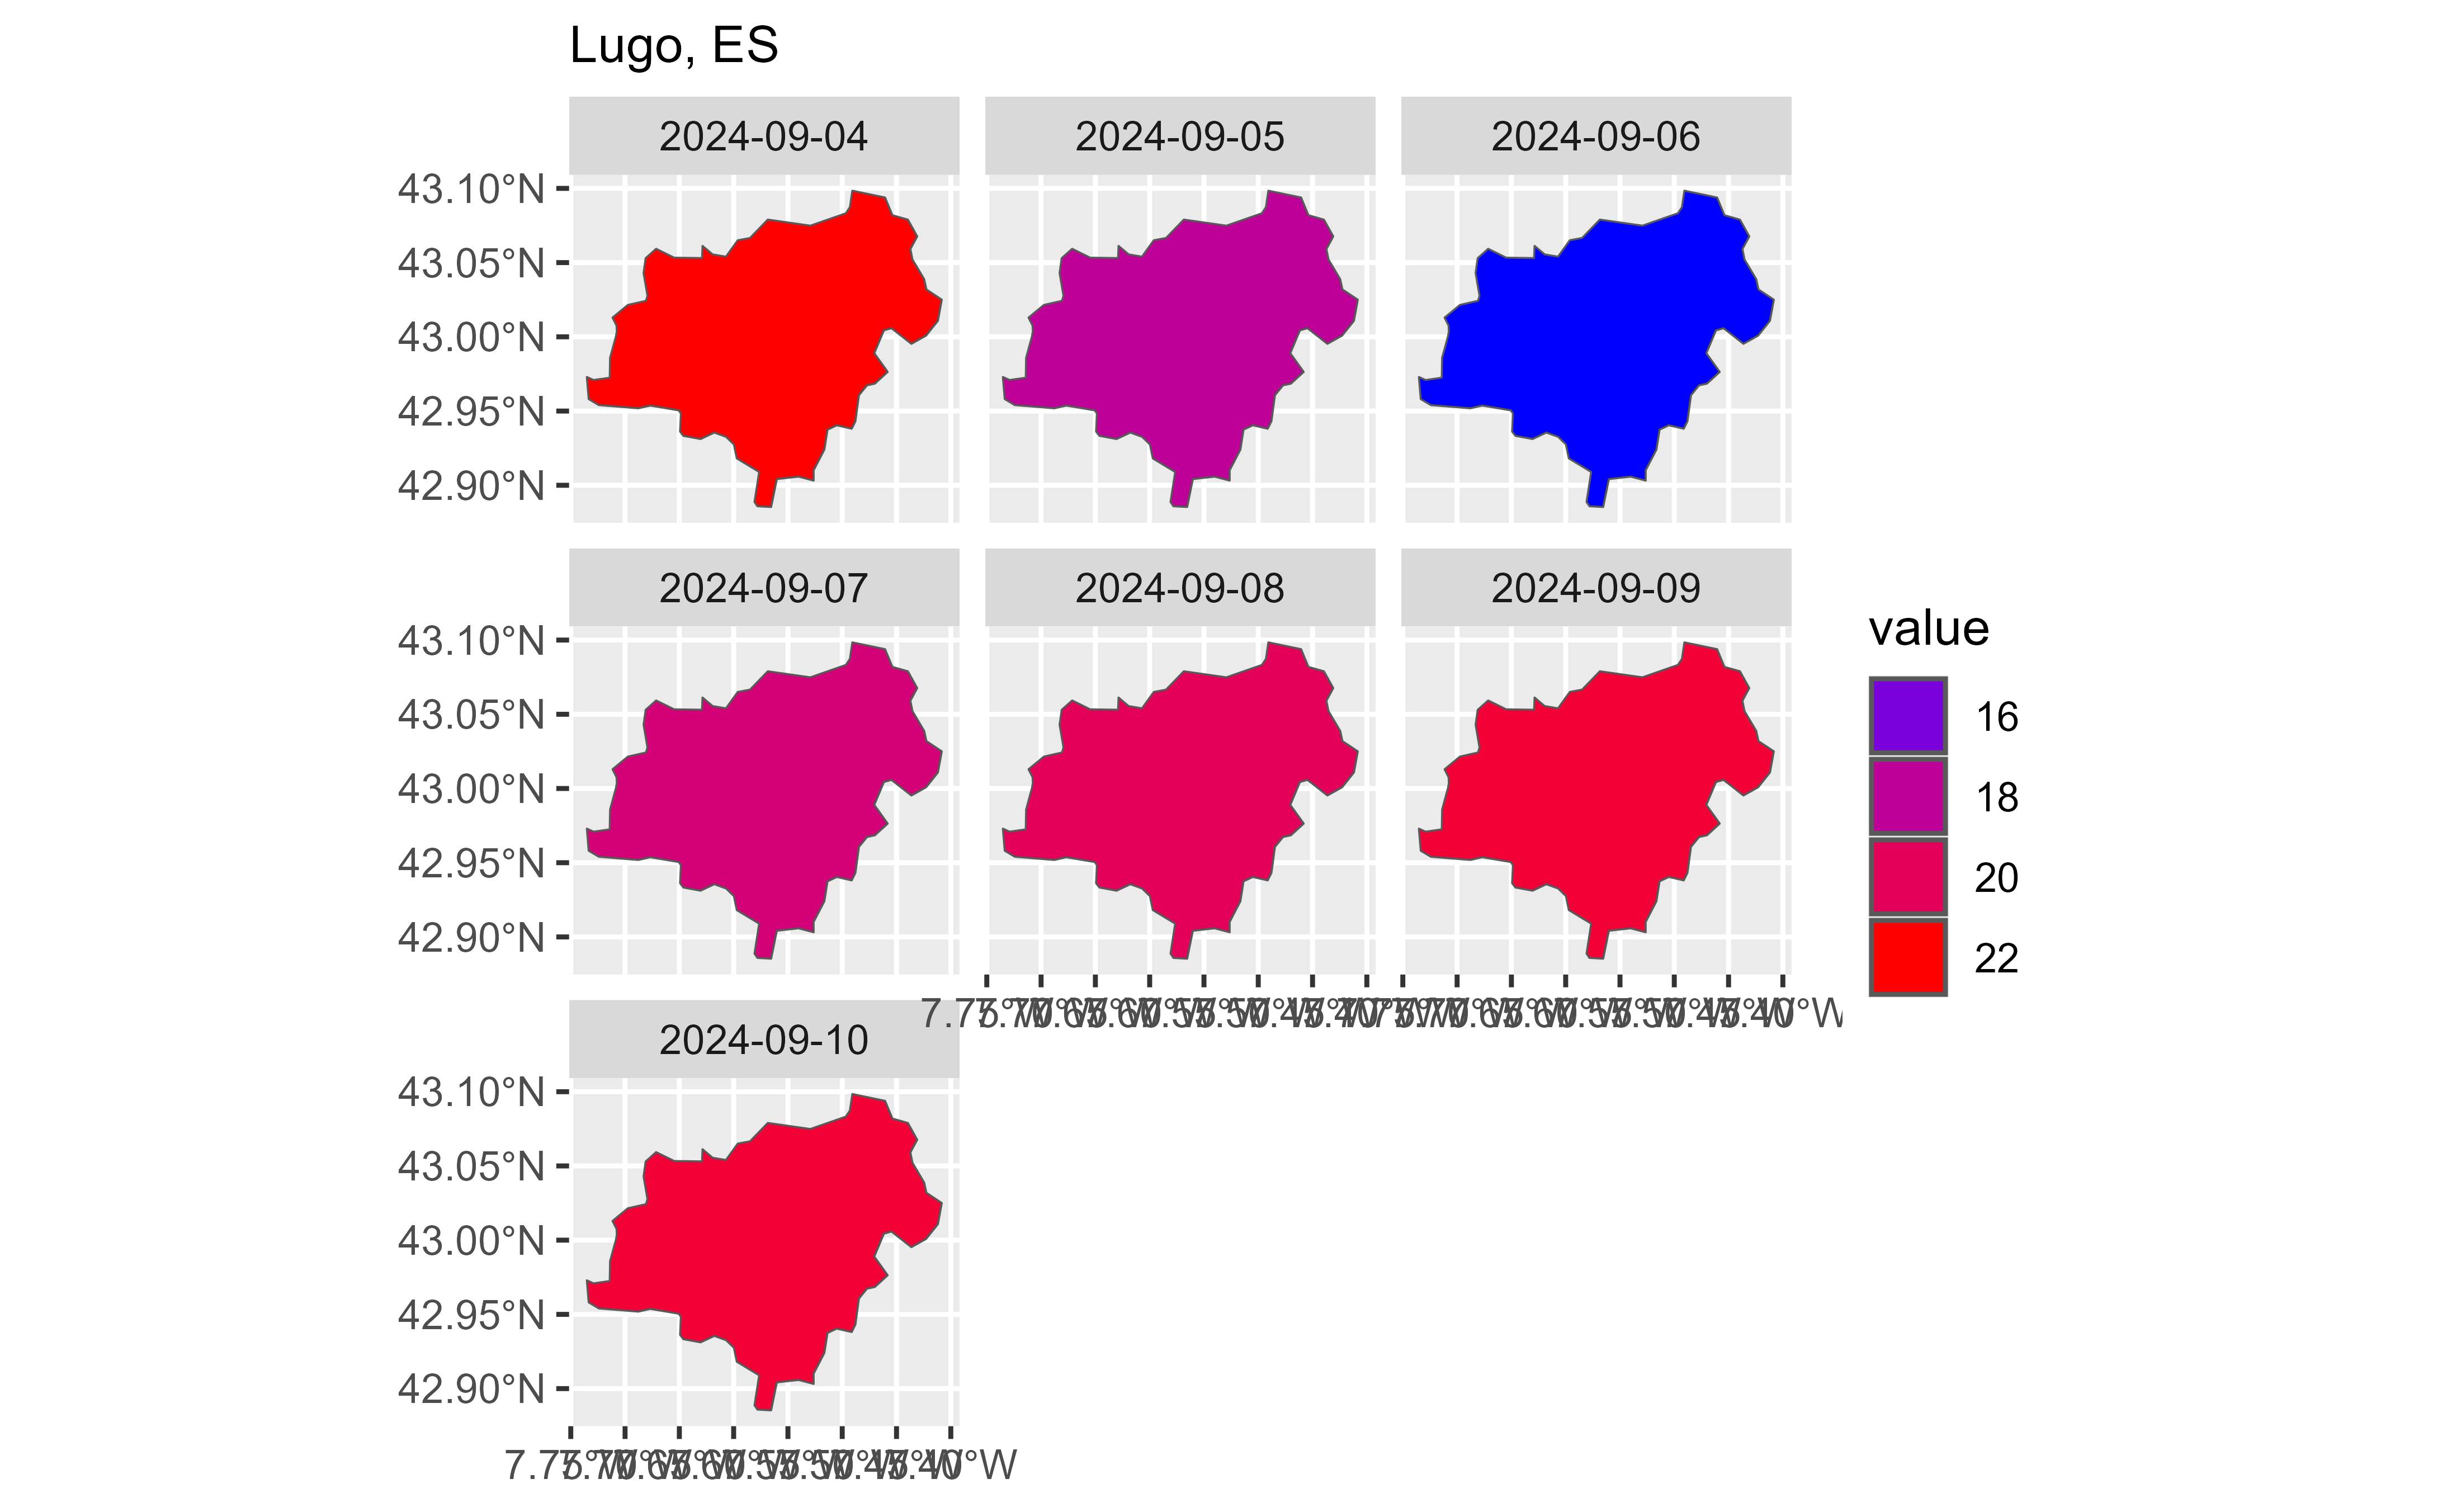
ggplot(daily_temp_end_lugo_sf) +
geom_sf(aes(fill = value)) +
facet_wrap(~fecha) +
scale_fill_gradientn(
colors = c("blue", "red"),
guide = guide_legend()
) +
labs(
main = "Forecast: 7-day max temperature",
subtitle = "Lugo, ES"
)
#> Ignoring unknown labels:
#> • main : "Forecast: 7-day max temperature"
# Spatial data.
library(mapSpain)
library(sf)
#> Linking to GEOS 3.12.1, GDAL 3.8.4, PROJ 9.4.0; sf_use_s2() is TRUE
lugo_sf <- esp_get_munic(munic = "Lugo") |>
select(LAU_CODE)
#> ! The file to download is "74.6 Mb".
daily_temp_end_lugo_sf <- daily_temp_end |>
filter(nombre == "Lugo" & name == "temperatura_maxima") |>
# Join by LAU_CODE.
left_join(lugo_sf, by = c("municipio" = "LAU_CODE")) |>
st_as_sf()
ggplot(daily_temp_end_lugo_sf) +
geom_sf(aes(fill = value)) +
facet_wrap(~fecha) +
scale_fill_gradientn(
colors = c("blue", "red"),
guide = guide_legend()
) +
labs(
main = "Forecast: 7-day max temperature",
subtitle = "Lugo, ES"
)
#> Ignoring unknown labels:
#> • main : "Forecast: 7-day max temperature"