mapSpain provides administrative boundaries of Spain at several levels, including Autonomous Communities and Cities, provinces, municipalities and NUTS, as sf objects.
mapSpain also includes tools to download and process static map tiles and a leaflet plugin for Spanish public administration tile providers.
The full package website, with examples and vignettes, is available at https://ropenspain.github.io/mapSpain/.
Installation
Install mapSpain from CRAN:
install.packages("mapSpain", dependencies = TRUE)Usage
The following examples highlight some key features of mapSpain.
library(mapSpain)
library(sf)
library(dplyr)
census <- mapSpain::pobmun25 |>
  select(-name)

# Extract Autonomous Community or City codes from the base dataset.
codelist <- mapSpain::esp_codelist |>
  select(cpro, codauto) |>
  distinct()

census_ccaa <- census |>
  left_join(codelist) |>
  # Summarize by Autonomous Community or City.
  group_by(codauto) |>
  summarise(pob25 = sum(pob25), men = sum(men), women = sum(women)) |>
  mutate(
    porc_women = women / pob25,
    porc_women_lab = paste0(round(100 * porc_women, 2), "%")
  )

# Merge into spatial data.
ccaa_sf <- esp_get_ccaa() |>
  left_join(census_ccaa)

can <- esp_get_can_box()

# Plot with ggplot.
library(ggplot2)

ggplot(ccaa_sf) +
  geom_sf(aes(fill = porc_women), color = "grey70", linewidth = 0.3) +
  geom_sf(data = can, color = "grey70") +
  geom_sf_label(
    aes(label = porc_women_lab),
    fill = "white",
    alpha = 0.5,
    size = 3,
    linewidth = 0
  ) +
  scale_fill_gradientn(
    colors = hcl.colors(10, "Blues", rev = TRUE),
    n.breaks = 10,
    labels = scales::label_percent(),
    guide = guide_legend(title = "% women", position = "inside")
  ) +
  theme_void() +
  theme(legend.position.inside = c(0.1, 0.6)) +
  labs(caption = "Source: CartoBase ANE 2006-2024 CC-BY 4.0 ign.es, INE")
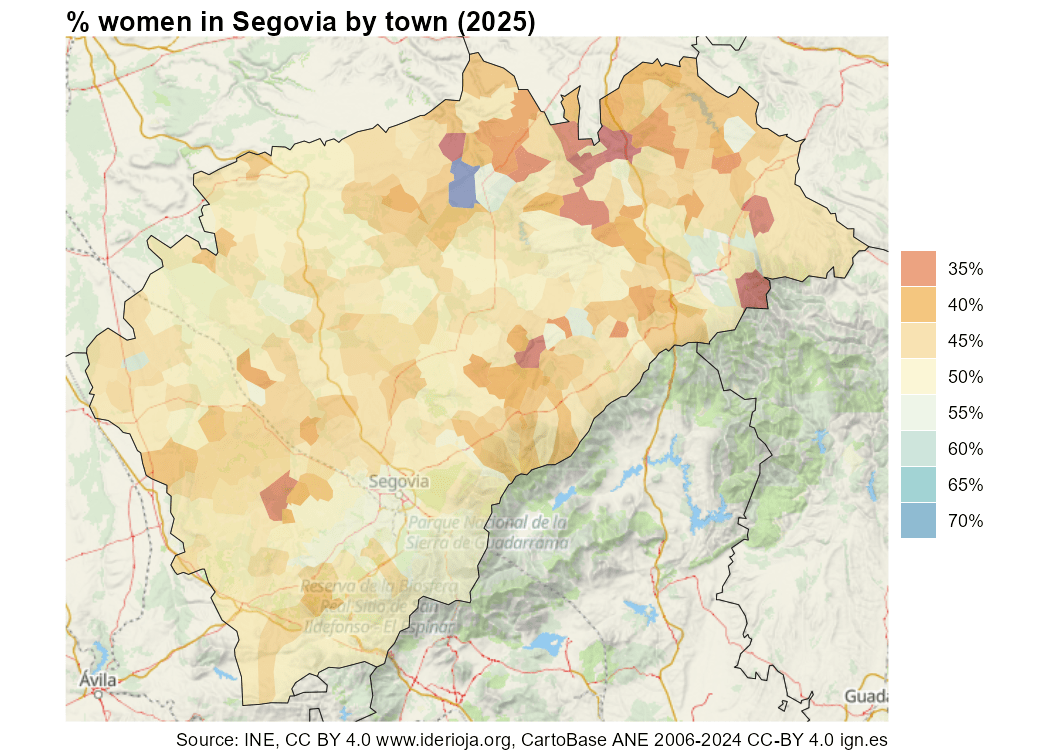
You can combine sf objects with static map tiles.
# Get census data.
census <- mapSpain::pobmun25 |>
  mutate(porc_women = women / pob25) |>
  select(cpro, cmun, porc_women)

# Get municipality and province geometries.
shape <- esp_get_munic_siane(region = "Segovia", epsg = 3857)
provs <- esp_get_prov_siane(epsg = 3857)

shape_pop <- shape |> left_join(census)

tile <- esp_get_tiles(shape_pop, type = "IDErioja.Relieve", zoommin = 1)

# Plot.

library(ggplot2)
library(tidyterra)

lims <- as.vector(terra::ext(tile))

ggplot(remove_missing(shape_pop, na.rm = TRUE)) +
  geom_spatraster_rgb(data = tile, maxcell = 10e6) +
  geom_sf(aes(fill = porc_women), color = NA) +
  geom_sf(data = provs, fill = NA) +
  scale_fill_gradientn(
    colours = hcl.colors(10, "RdYlBu", alpha = 0.5),
    n.breaks = 8,
    labels = function(x) {
      sprintf("%1.0f%%", 100 * x)
    },
    guide = guide_legend(title = "")
  ) +
  coord_sf(
    xlim = lims[c(1, 2)],
    ylim = lims[c(3, 4)],
    expand = FALSE
  ) +
  labs(
    title = "% women in Segovia by town (2025)",
    caption = paste0(
      "Source: INE, CC BY 4.0 www.iderioja.org, ",
      "CartoBase ANE 2006-2024 CC-BY 4.0 ign.es"
    )
  ) +
  theme_void() +
  theme(
    title = element_text(face = "bold")
  )
mapSpain and giscoR
If you need to plot Spain alongside other countries, use the giscoR package, which is installed as a dependency of mapSpain. Here is a basic example:
library(giscoR)

# Set the same resolution for a perfect fit.

res <- "20"

all_countries <- gisco_get_countries(resolution = res) |>
  st_transform(3035)

eu_countries <- gisco_get_countries(resolution = res, region = "EU") |>
  st_transform(3035)

ccaa <- esp_get_ccaa(moveCAN = FALSE, resolution = res) |>
  st_transform(3035)

library(ggplot2)

ggplot(all_countries) +
  geom_sf(fill = "#DFDFDF", color = "#656565") +
  geom_sf(data = eu_countries, fill = "#FDFBEA", color = "#656565") +
  geom_sf(data = ccaa, fill = "#C12838", color = "grey80", linewidth = 0.1) +
  # Center on Europe: EPSG 3035.
  coord_sf(xlim = c(2377294, 7453440), ylim = c(1313597, 5628510)) +
  theme(
    panel.background = element_blank(),
    panel.grid = element_line(colour = "#DFDFDF", linetype = "dotted")
  ) +
  labs(caption = giscoR::gisco_attributions("es"))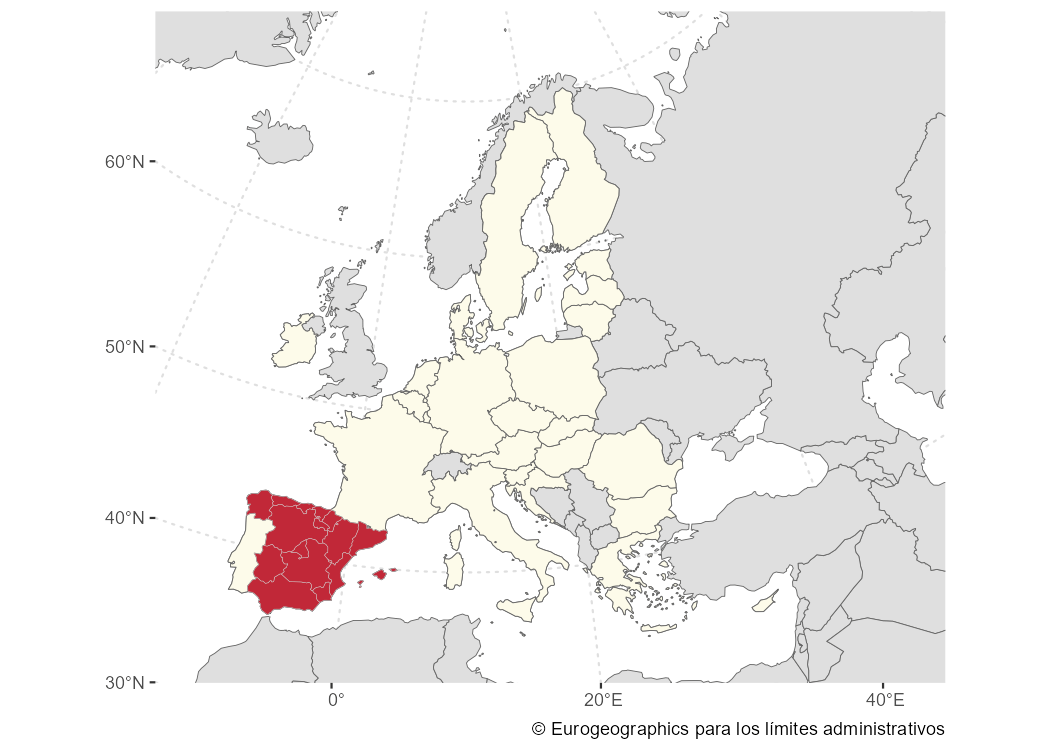
Caching
Some datasets and tiles may be larger than 50 MB. You can use mapSpain to create a local cache directory with esp_set_cache_dir():
esp_set_cache_dir("./path/to/location")When a cache directory is set, mapSpain looks for cached files before downloading them again, which speeds up subsequent calls.
Citation
Hernangómez D (2026). mapSpain: Administrative Boundaries and Static Map Tiles for Spain. doi:10.5281/zenodo.5366622. https://ropenspain.github.io/mapSpain/.
A BibTeX entry for LaTeX users is:
@Manual{R-mapspain,
  title = {{mapSpain}: Administrative Boundaries and Static Map Tiles for Spain},
  year = {2026},
  version = {1.2.0},
  author = {Diego Hernangómez},
  doi = {10.5281/zenodo.5366622},
  url = {https://ropenspain.github.io/mapSpain/},
  abstract = {Administrative boundaries of Spain at several levels (Autonomous Communities and Cities, provinces, municipalities and NUTS), based on GISCO from Eurostat <https://ec.europa.eu/eurostat/web/gisco> and CartoBase ANE (Atlas Nacional de España) from Instituto Geográfico Nacional <https://www.ign.es/>. Includes tools to download and process static map tiles and a leaflet plugin for Spanish public administration tile providers.},
}
Contribute
Check the GitHub page for the source code.
Copyright notice
This package uses data from CartoBase ANE, provided by the Instituto Geográfico Nacional.
See https://github.com/rOpenSpain/mapSpain/tree/sianedata.
This package also uses data from GISCO, Eurostat’s geospatial open data repository, which provides datasets at several resolution levels.
From GISCO > Geodata > Reference data > Administrative Units / Statistical Units
When data downloaded from this page is used in any printed or electronic publication, in addition to any other provisions applicable to the whole Eurostat website, data source will have to be acknowledged in the legend of the map and in the introductory page of the publication with the following copyright notice:
EN: © EuroGeographics for the administrative boundaries
FR: © EuroGeographics pour les limites administratives
DE: © EuroGeographics bezüglich der Verwaltungsgrenzen
For publications in languages other than English, French or German, the translation of the copyright notice in the language of the publication shall be used.
If you intend to use the data commercially, please contact EuroGeographics for information regarding their license agreements.