Simplified map of provinces and Autonomous Communities and Cities of Spain
Source:R/esp-get-simpl.R
esp_get_simpl.RdSimplified map with the boundaries of the provinces or Autonomous Communities of Spain, as provided by the INE (Instituto Nacional de Estadística).
Usage
esp_get_simpl_prov(
  prov = NULL,
  update_cache = FALSE,
  cache_dir = NULL,
  verbose = FALSE
)

esp_get_simpl_ccaa(
  ccaa = NULL,
  update_cache = FALSE,
  cache_dir = NULL,
  verbose = FALSE
)Arguments
- prov, ccaa
Character. A vector of names, codes or both for provinces and Autonomous Communities and Cities, or
NULLto get all the data. See Details.- update_cache
Logical. If
TRUE, refreshes the cached file and forces a new download. Defaults toFALSE.- cache_dir
Character string. A path to a cache directory. See Caching.
- verbose
A logical value indicating whether to display informational messages.
Value
An sf object.
Details
Results are provided without CRS, as provided by the source.
You can use and mix names, ISO codes, "codauto" or "cpro" codes (see
esp_codelist) and NUTS codes of different levels.
When using a code corresponding to a higher level (for example,
esp_get_prov("Andalucia")), all the corresponding units of that level are
provided (in this case, all the provinces of Andalusia).
Caching
Functions that download data store files in cache_dir. When cache_dir
is NULL, they use the active package cache, which defaults to a temporary
directory. Set update_cache = TRUE to replace an existing cached file.
See Caching strategies in esp_set_cache_dir() to configure a
persistent cache.
See also
Additional boundary datasets and representations:
esp_get_comarca(),
esp_get_gridmap
Examples
# \donttest{
prov_simp <- esp_get_simpl_prov()
library(ggplot2)
ggplot(prov_simp) +
geom_sf(aes(fill = ine.ccaa.name)) +
labs(fill = "Autonomous Communities and Cities")
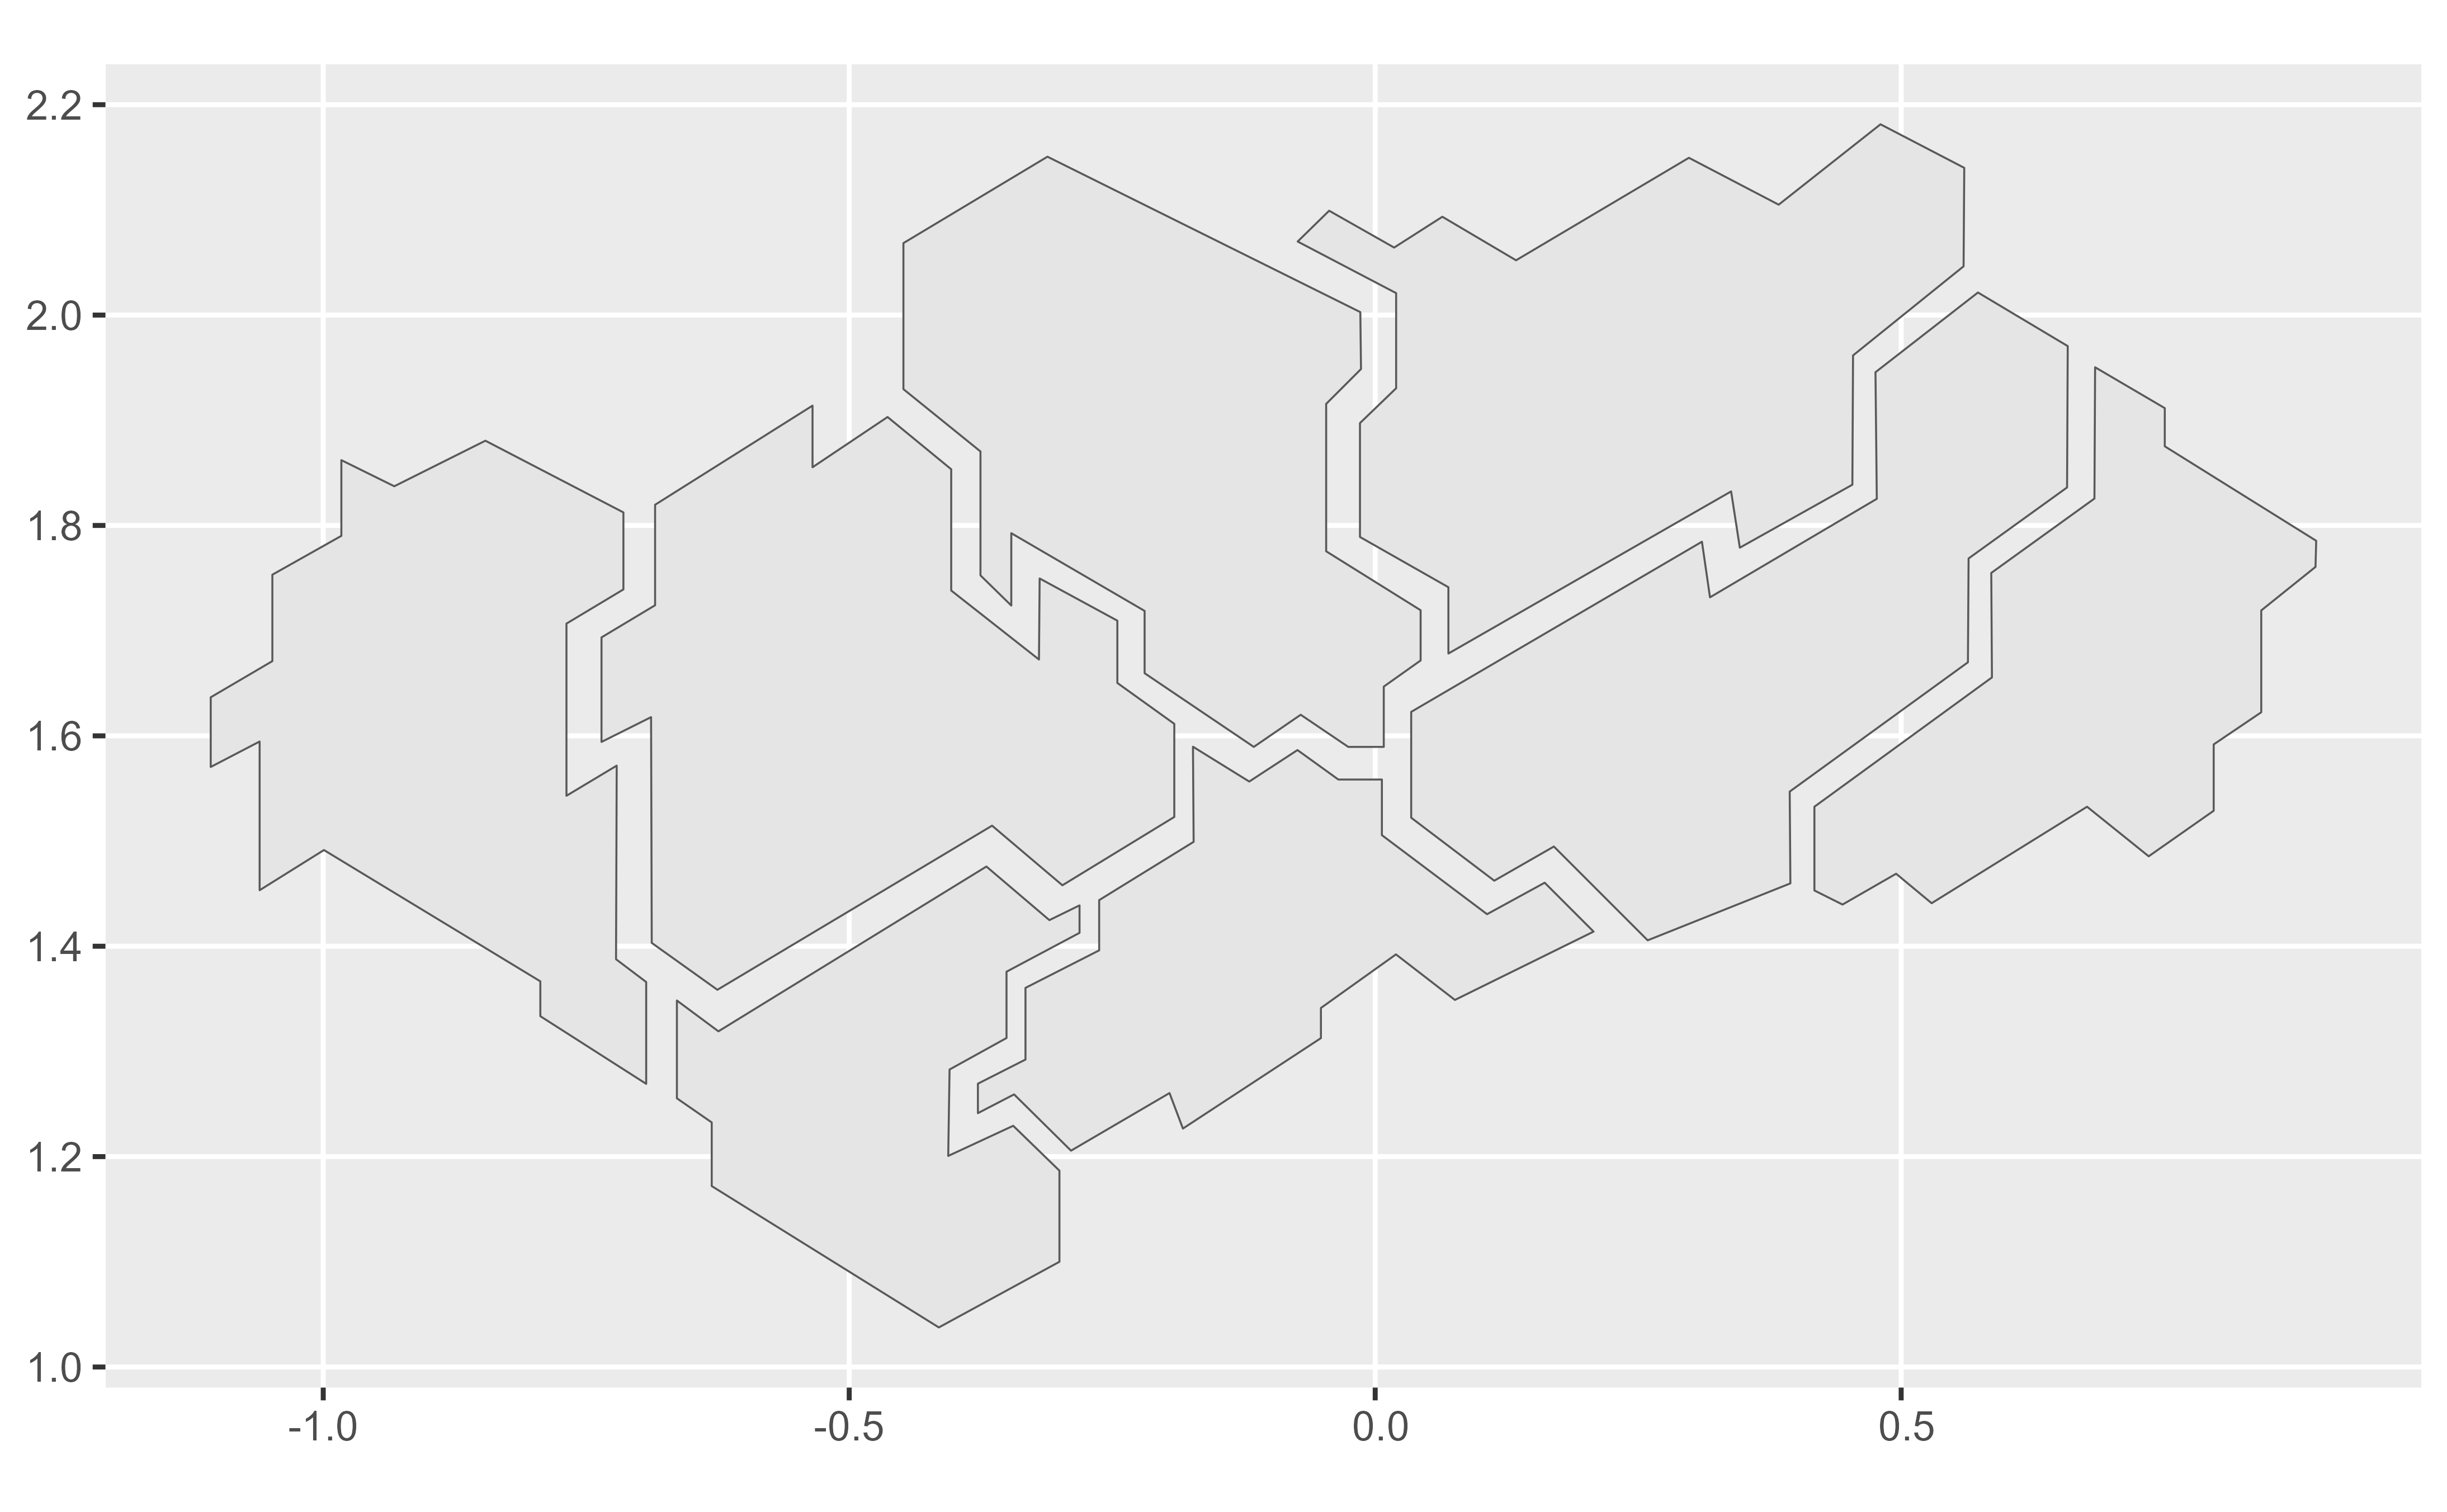
 # Provinces of a single Autonomous Community or City.
and_simple <- esp_get_simpl_prov("Andalucia")
ggplot(and_simple) +
geom_sf()
# Provinces of a single Autonomous Community or City.
and_simple <- esp_get_simpl_prov("Andalucia")
ggplot(and_simple) +
geom_sf()
 # Autonomous Communities and Cities.
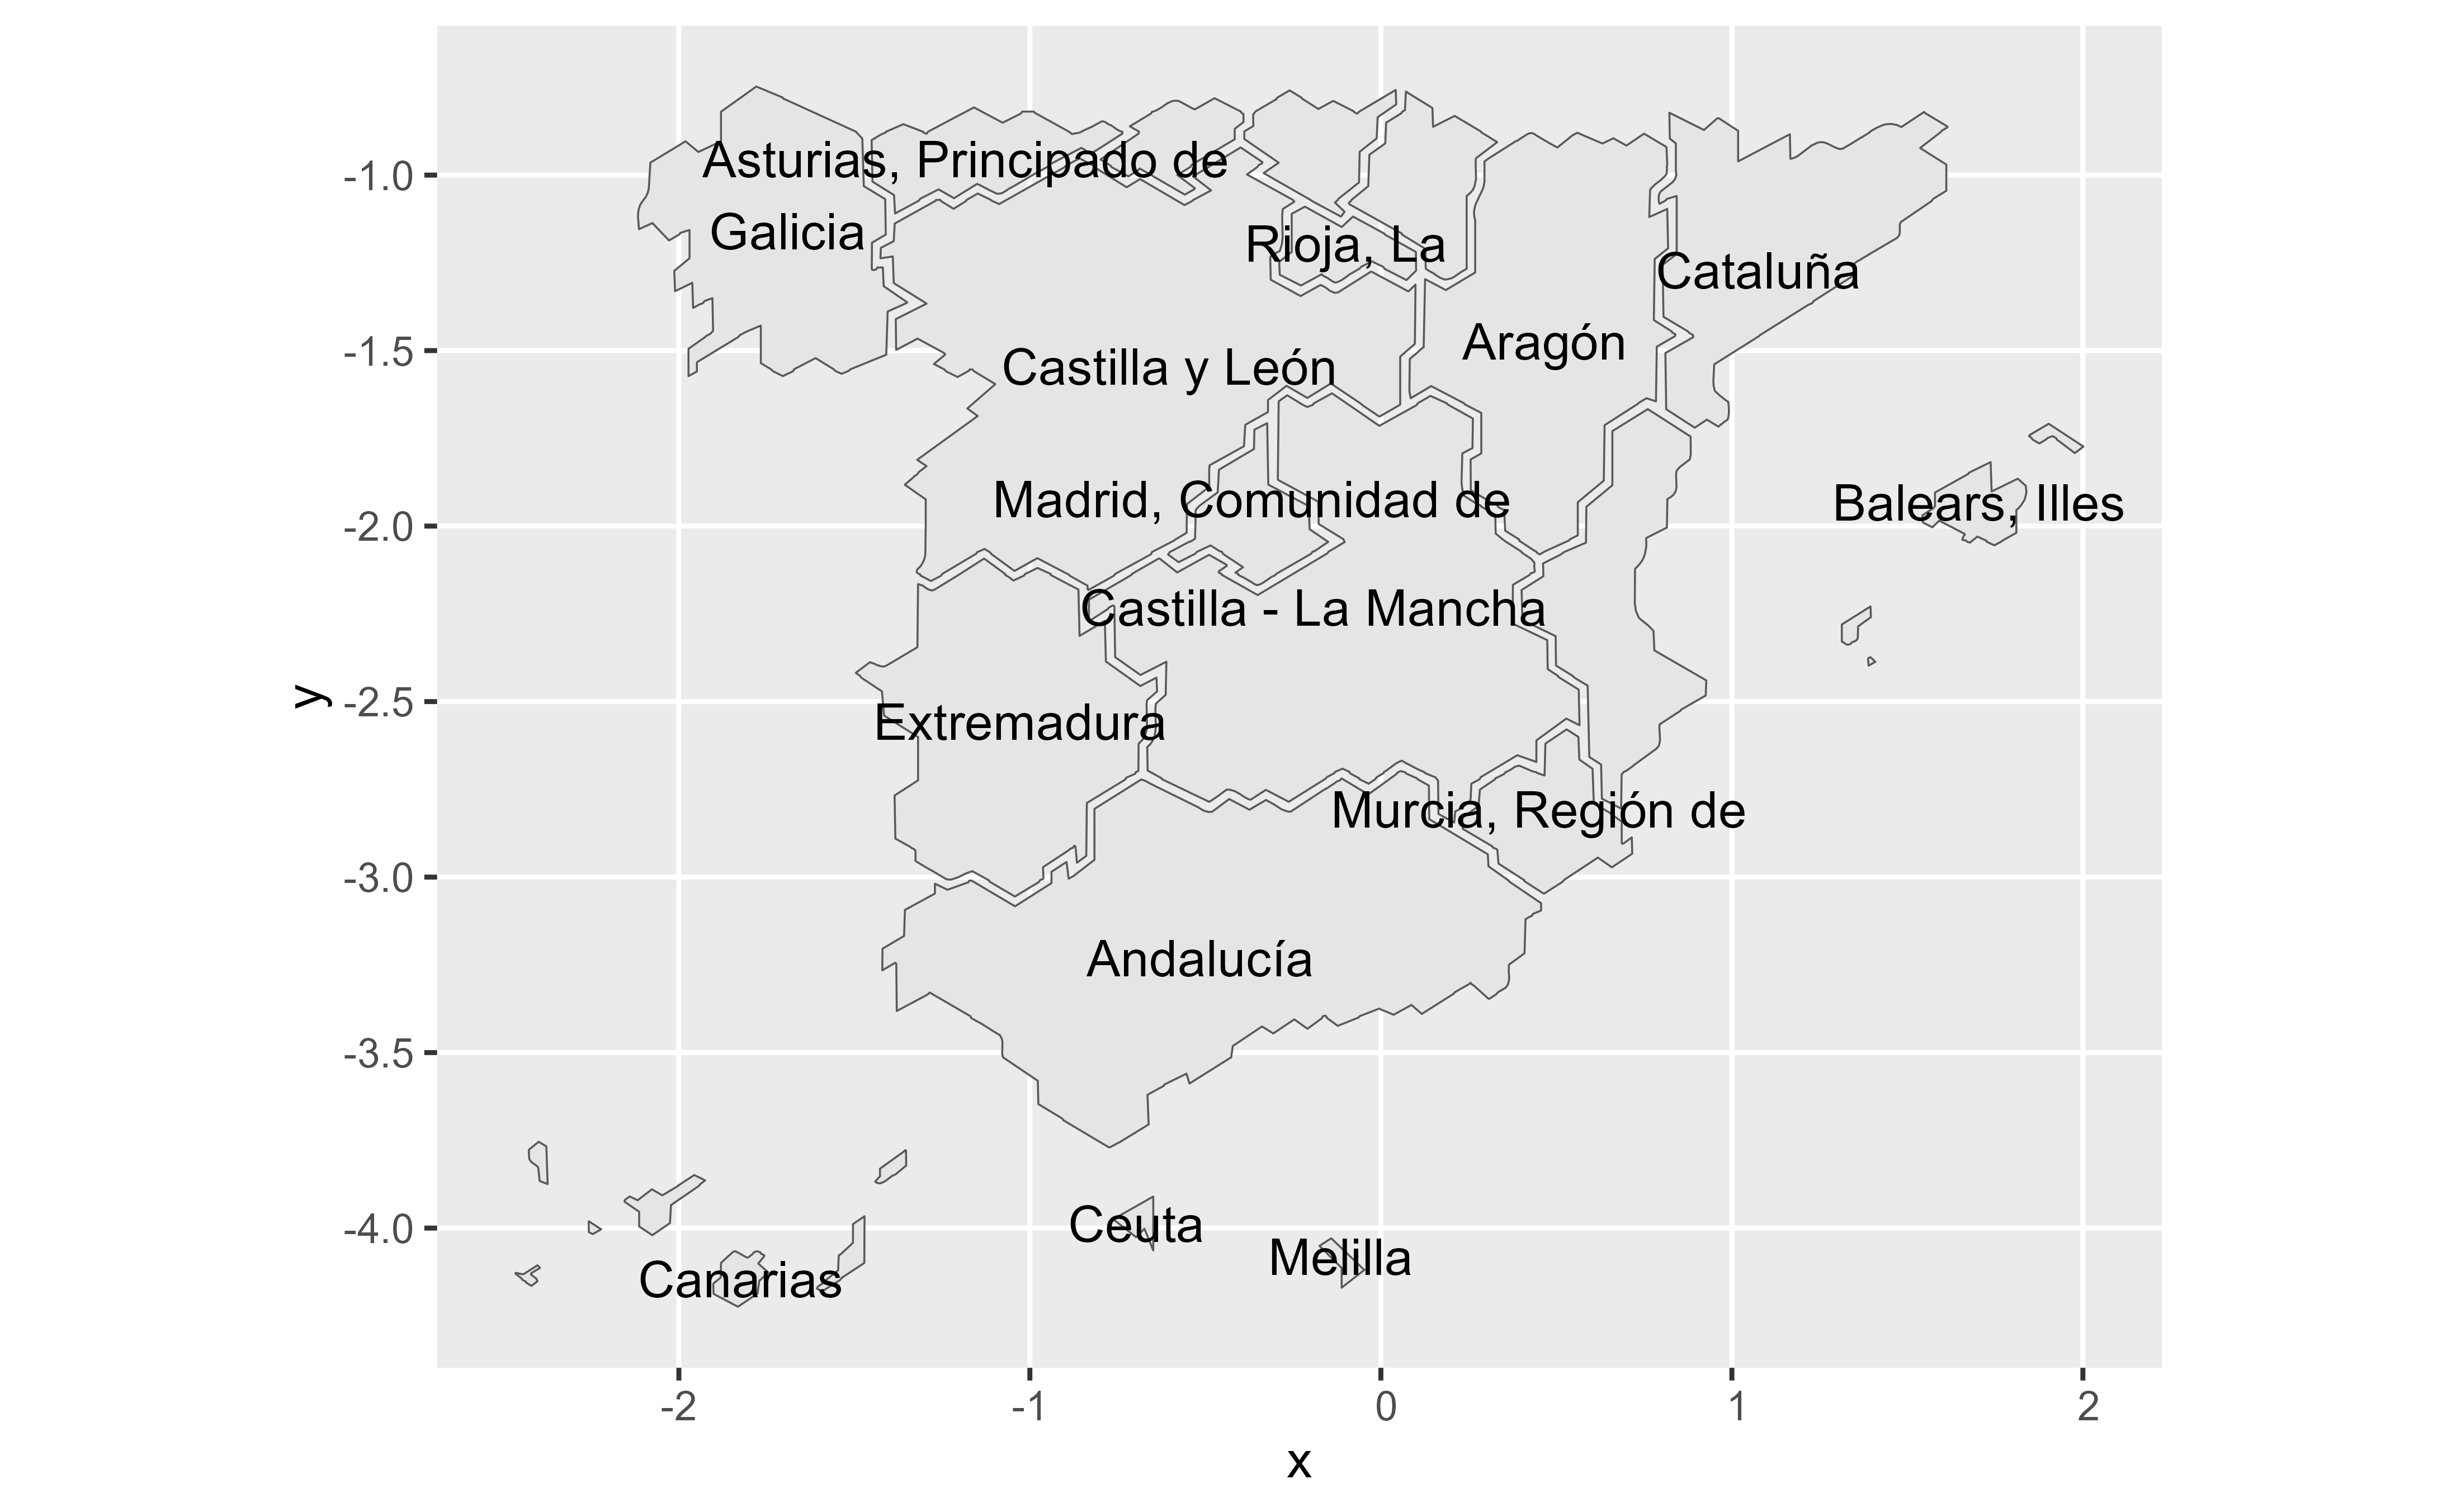
ccaa_simp <- esp_get_simpl_ccaa()
ggplot(ccaa_simp) +
geom_sf() +
geom_sf_text(aes(label = ine.ccaa.name), check_overlap = TRUE)
# Autonomous Communities and Cities.
ccaa_simp <- esp_get_simpl_ccaa()
ggplot(ccaa_simp) +
geom_sf() +
geom_sf_text(aes(label = ine.ccaa.name), check_overlap = TRUE)
 # }
# }