climaemet provides access to meteorological observations, forecasts, alerts and climatology data from the Spanish Meteorological Agency (AEMET). It also includes tools for working with tabular and spatial data and for creating Walter-Lieth climate diagrams, warming stripes and wind roses.
Browse the manual and vignettes at https://ropenspain.github.io/climaemet/.
AEMET OpenData API
AEMET OpenData is a REST API for accessing and reusing AEMET’s meteorological and climatological information. For details, visit https://opendata.aemet.es/centrodedescargas/inicio.
License for the original data
The data are prepared by the Spanish Meteorological Agency (© AEMET). See the AEMET legal notice for details.
A summary of data usage is:
People can use these data freely. You should mention AEMET as the collector of the original data in every situation except when you are using these data privately and individually. AEMET makes no warranty as to the accuracy or completeness of the data. All data are provided on an “as is” basis. AEMET is not responsible for any damage or loss derived from the interpretation or use of these data.
Installation
Install the released version of climaemet from CRAN with:
install.packages("climaemet")Install the development version of climaemet from r-universe:
# Install climaemet in R:
install.packages(
  "climaemet",
  repos = c(
    "https://ropenspain.r-universe.dev",
    "https://cloud.r-project.org"
  )
)
Alternatively, install the development version of climaemet with:
# install.packages("pak")
pak::pak("ropenspain/climaemet")
API key
To download data from AEMET, obtain a free API key from the AEMET OpenData registration page.
library(climaemet)

# Open the AEMET OpenData registration page.
browseURL("https://opendata.aemet.es/centrodedescargas/altaUsuario")

# Set the API key for the current R session.
aemet_api_key("MY API KEY")
Migrating from versions before 1.0.0
Versions before 1.0.0 accepted an apikey argument in data-access functions. Current code should set the API key globally with aemet_api_key() and remove the obsolete apikey argument.
Data formats
Tabular results
climaemet returns tabular results as tibble objects. The package also infers column types when possible. For example, date and time columns are parsed as date-time objects and numeric columns are parsed as doubles.
library(climaemet)

# Inspect a tibble.

aemet_last_obs("9434")
#> # A tibble: 12 × 25
#>    idema   lon fint                 prec   alt  vmax    vv    dv   lat  dmax
#>    <chr> <dbl> <dttm>              <dbl> <dbl> <dbl> <dbl> <dbl> <dbl> <dbl>
#>  1 9434  -1.00 2026-07-18 07:00:00     0   249   8.3   5.5   314  41.7   315
#>  2 9434  -1.00 2026-07-18 08:00:00     0   249   9     6     319  41.7   310
#>  3 9434  -1.00 2026-07-18 09:00:00     0   249   7.5   3.4   319  41.7   295
#>  4 9434  -1.00 2026-07-18 10:00:00     0   249   5.1   2.7   312  41.7   273
#>  5 9434  -1.00 2026-07-18 11:00:00     0   249   5.4   2.3   315  41.7   220
#>  6 9434  -1.00 2026-07-18 12:00:00     0   249   3.9   1.6   258  41.7   330
#>  7 9434  -1.00 2026-07-18 13:00:00     0   249   3.5   1.7   124  41.7   115
#>  8 9434  -1.00 2026-07-18 14:00:00     0   249   4.1   1.7    86  41.7   110
#>  9 9434  -1.00 2026-07-18 15:00:00     0   249   5.7   3.6   121  41.7   128
#> 10 9434  -1.00 2026-07-18 16:00:00     0   249   5.6   3.9   113  41.7   118
#> 11 9434  -1.00 2026-07-18 17:00:00     0   249   4.7   2.4    99  41.7   120
#> 12 9434  -1.00 2026-07-18 18:00:00     0   249   3.1   1.3    16  41.7    95
#> # ℹ 15 more variables: ubi <chr>, pres <dbl>, hr <dbl>, stdvv <dbl>, ts <dbl>,
#> #   pres_nmar <dbl>, tamin <dbl>, ta <dbl>, tamax <dbl>, tpr <dbl>,
#> #   stddv <dbl>, inso <dbl>, tss5cm <dbl>, pacutp <dbl>, tss20cm <dbl>
Spatial outputs
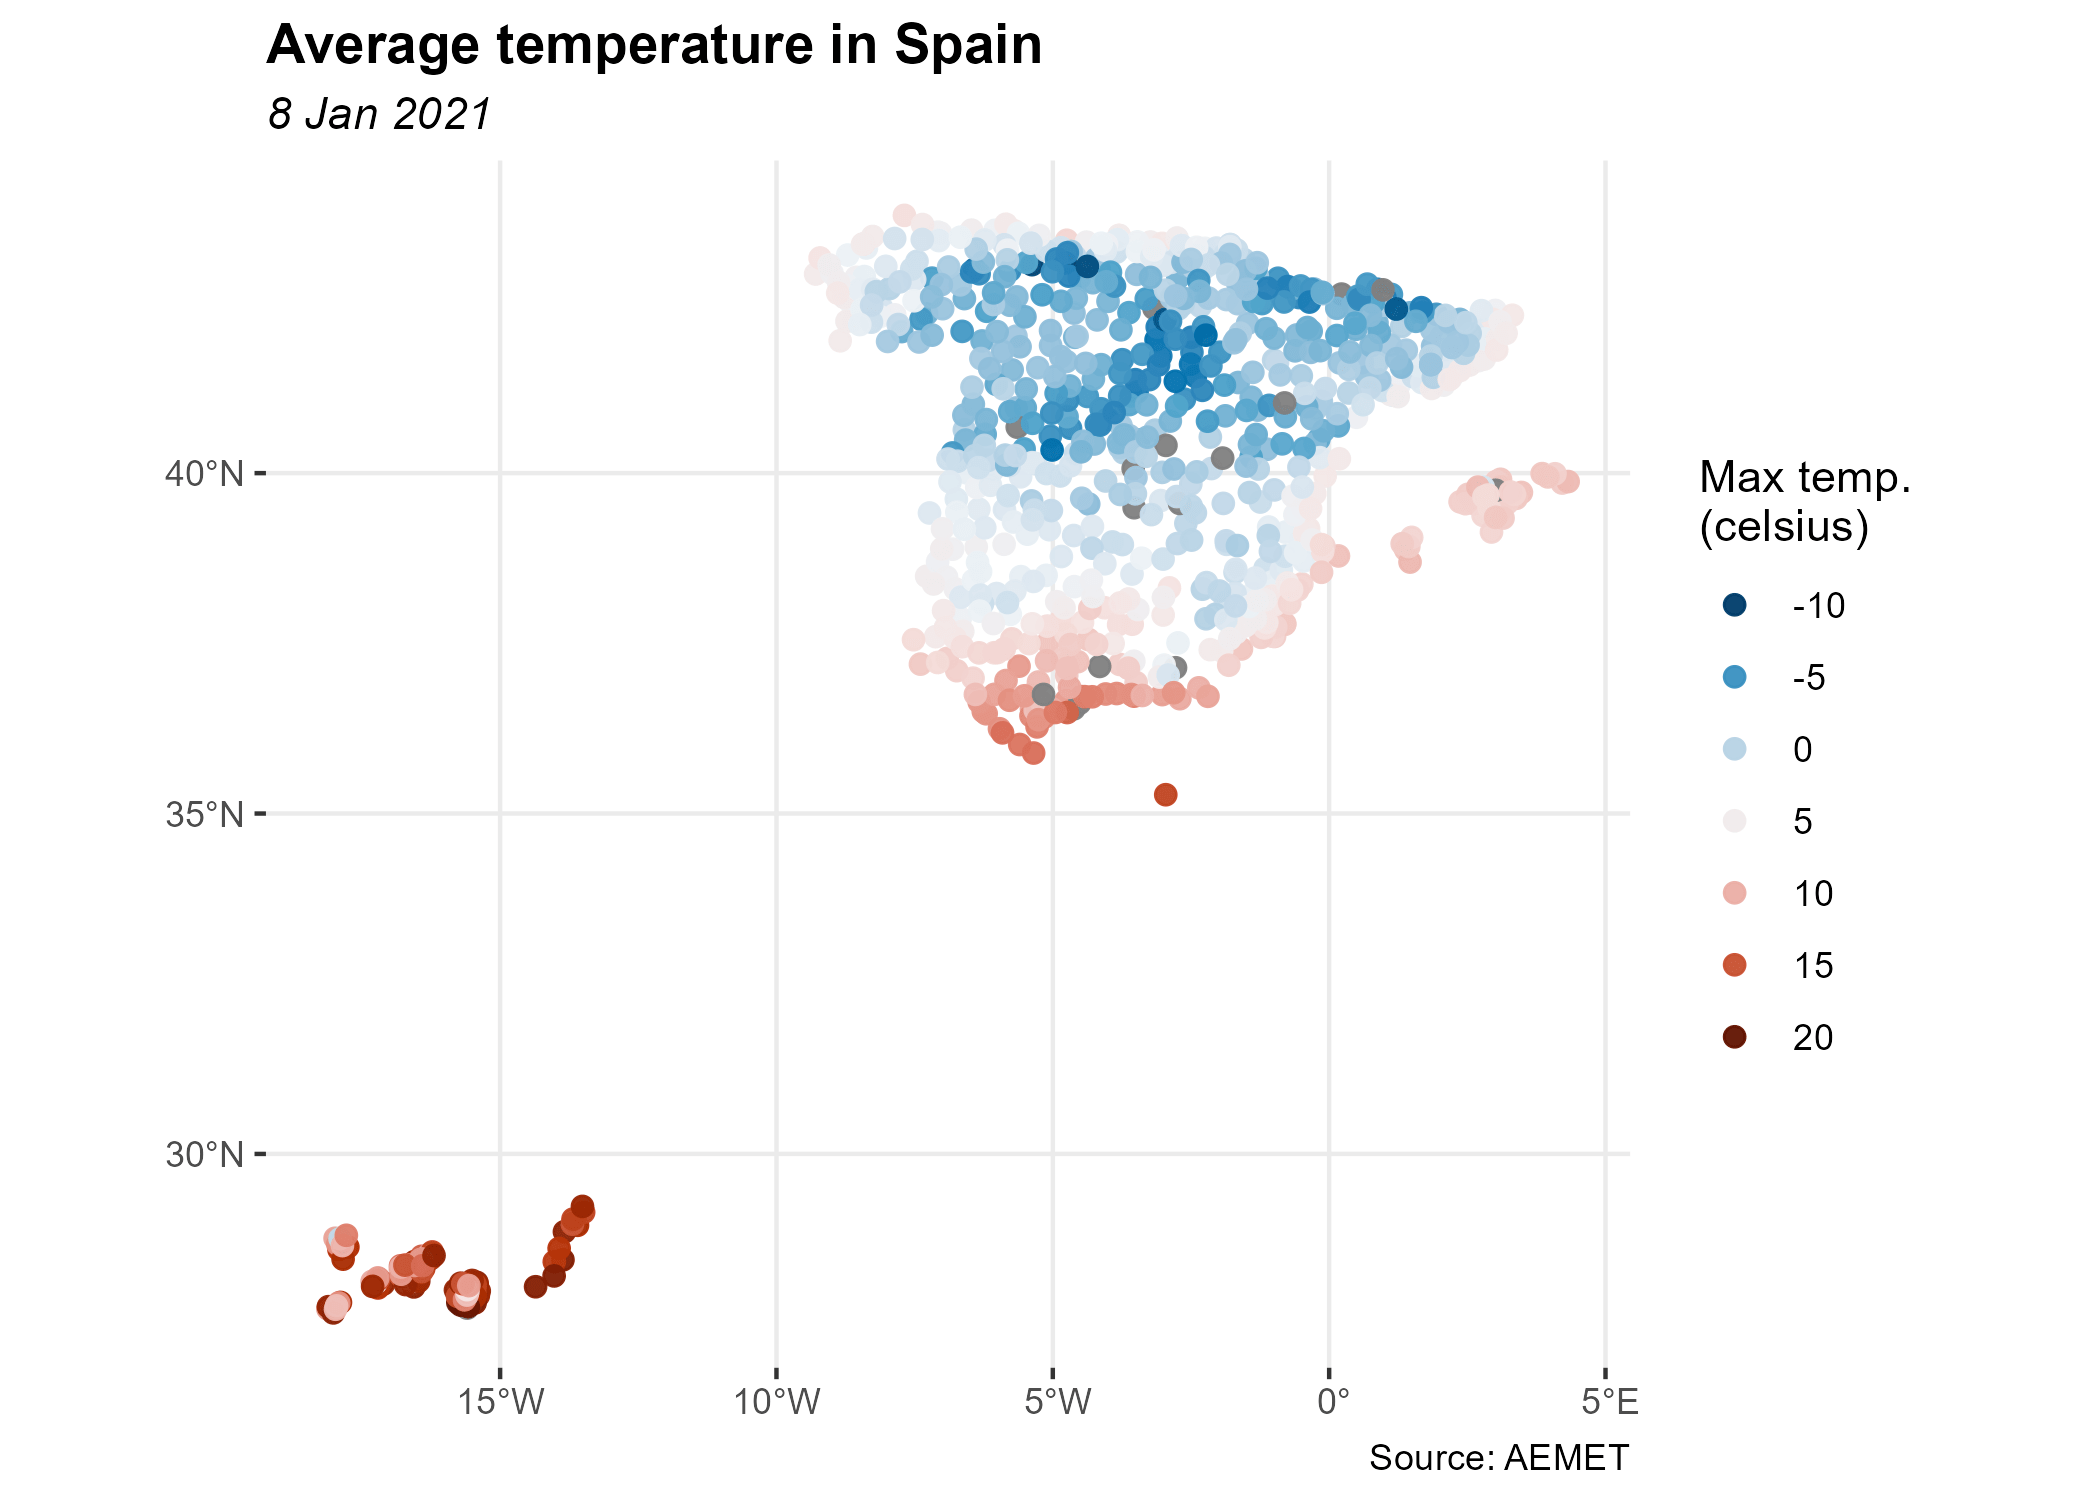
Data-access functions that support return_sf = TRUE can return spatial sf objects. These objects use the EPSG:4326 coordinate reference system (CRS), corresponding to the World Geodetic System 1984 (WGS 84), with unprojected longitude and latitude coordinates:
# You need to install sf if it is not already installed.
# Run install.packages("sf") to install it.
library(ggplot2)
library(dplyr)

all_stations <- aemet_daily_clim(
  start = "2021-01-08",
  end = "2021-01-08",
  return_sf = TRUE
)

ggplot(all_stations) +
  geom_sf(aes(colour = tmed), shape = 19, size = 2, alpha = 0.95) +
  labs(
    title = "Average temperature in Spain",
    subtitle = "8 Jan 2021",
    color = "Mean temp.\n(°C)",
    caption = "Source: AEMET"
  ) +
  scale_colour_gradientn(
    colours = hcl.colors(10, "RdBu", rev = TRUE),
    breaks = c(-10, -5, 0, 5, 10, 15, 20),
    guide = "legend"
  ) +
  theme_bw() +
  theme(
    panel.border = element_blank(),
    plot.title = element_text(face = "bold"),
    plot.subtitle = element_text(face = "italic")
  )
Plots
You can create warming stripes from temperature data recorded at weather stations. The plotting functions return ggplot2 objects:
# Plot warming stripes for a weather station.

library(ggplot2)

# Load example data.
temp_data <- climaemet::climaemet_9434_temp

ggstripes(temp_data, plot_title = "Zaragoza Airport") +
  labs(subtitle = "(1950-2020)")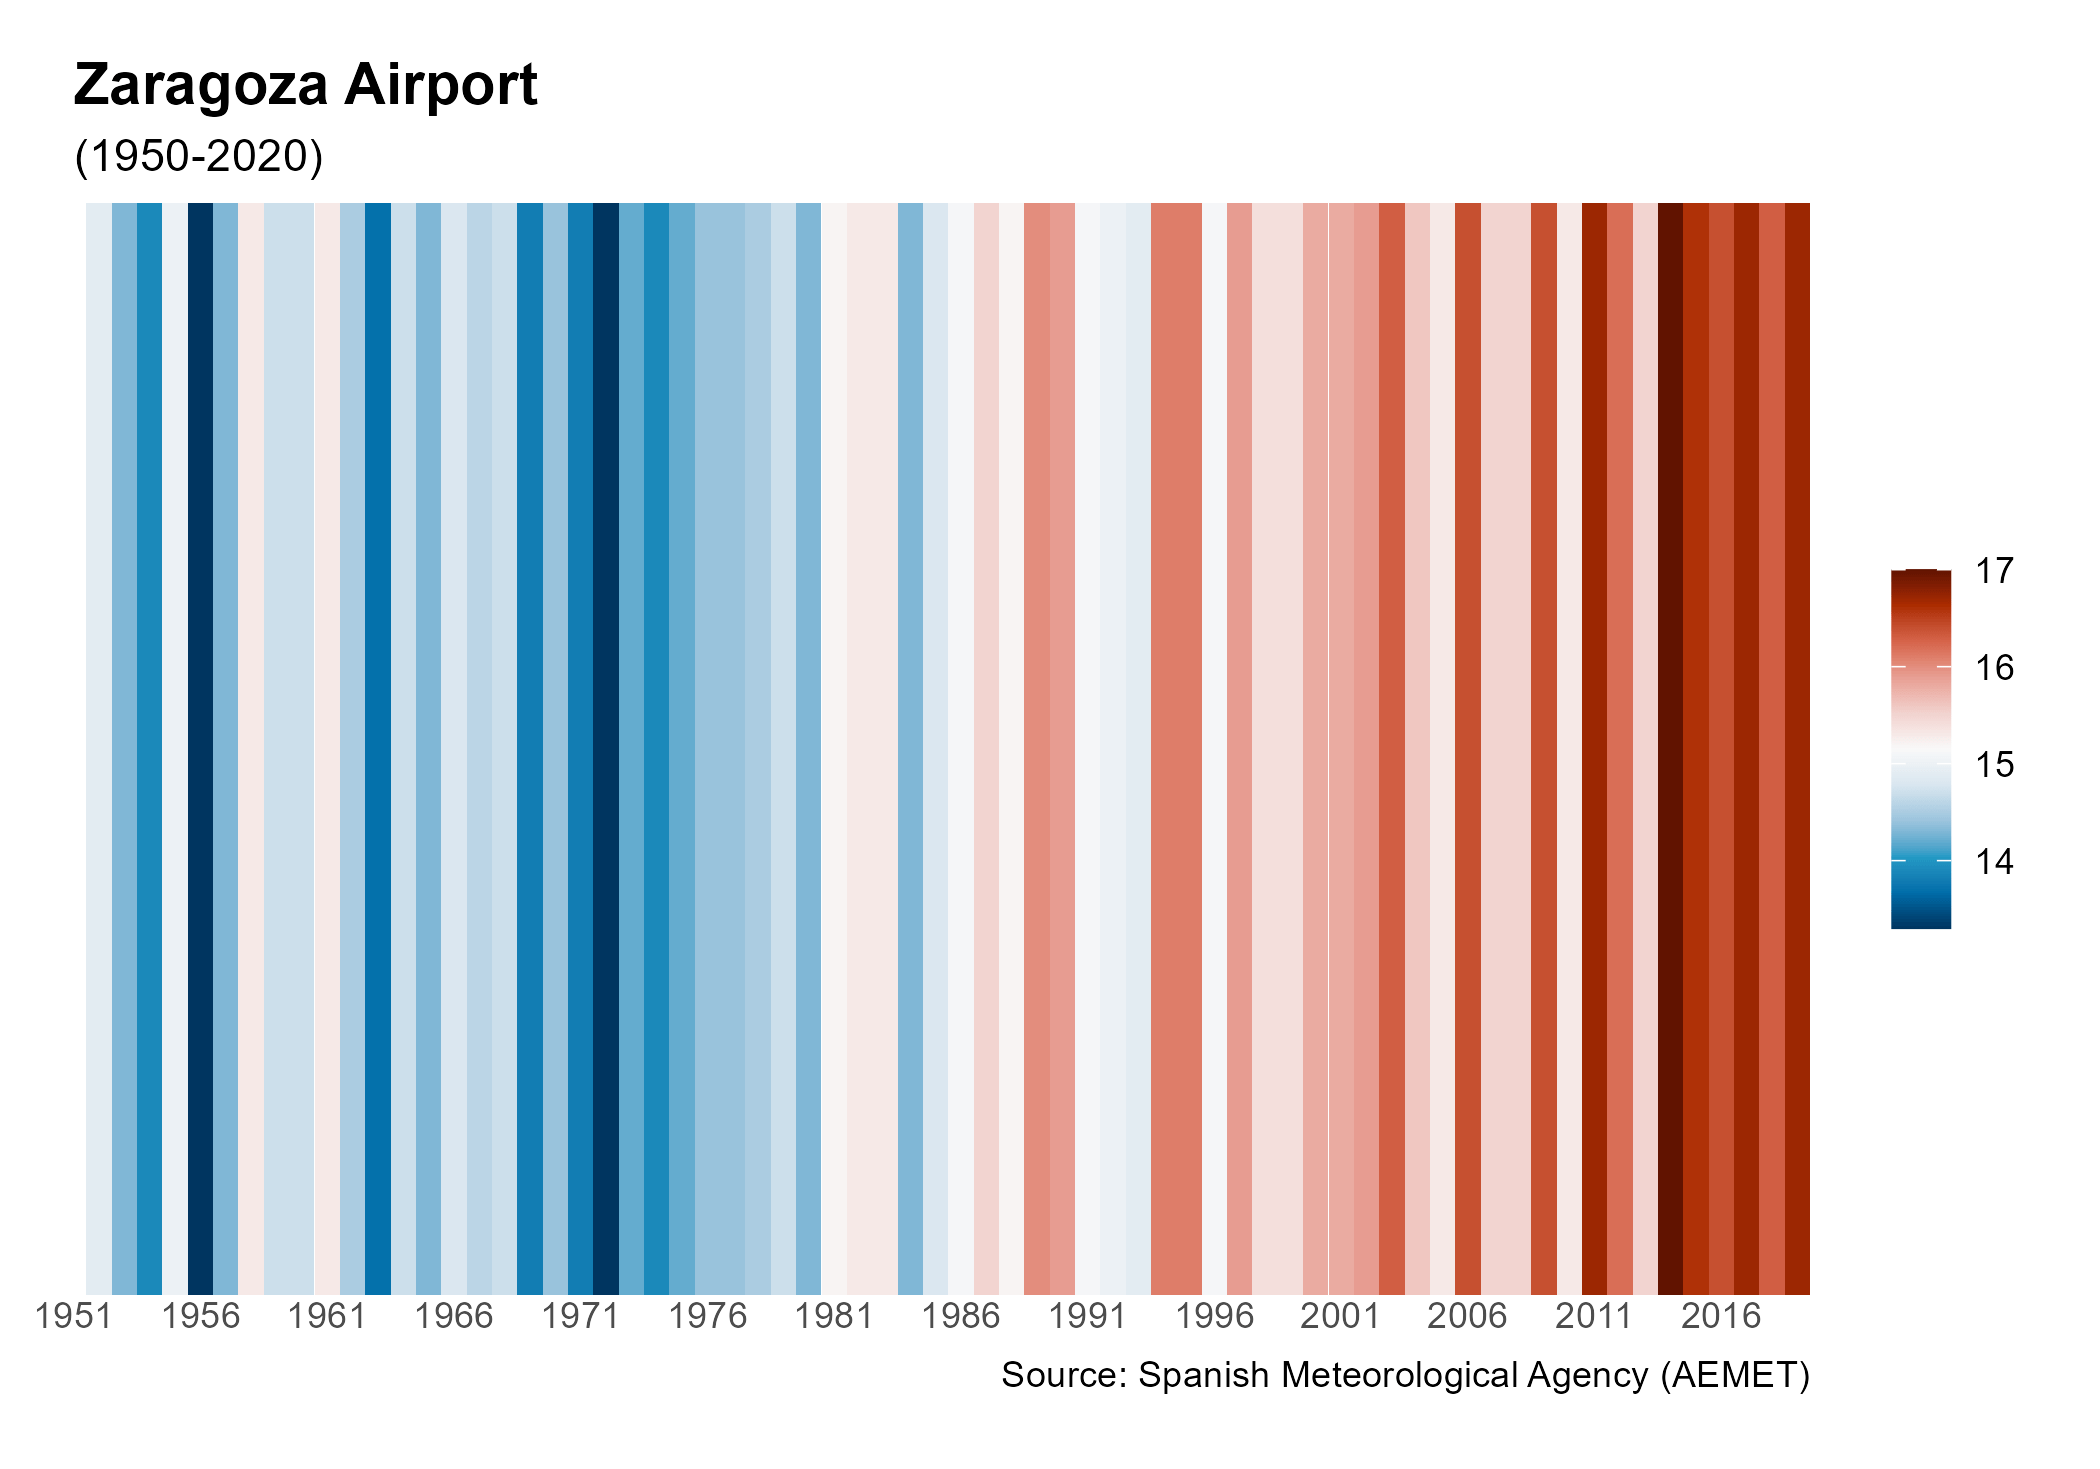
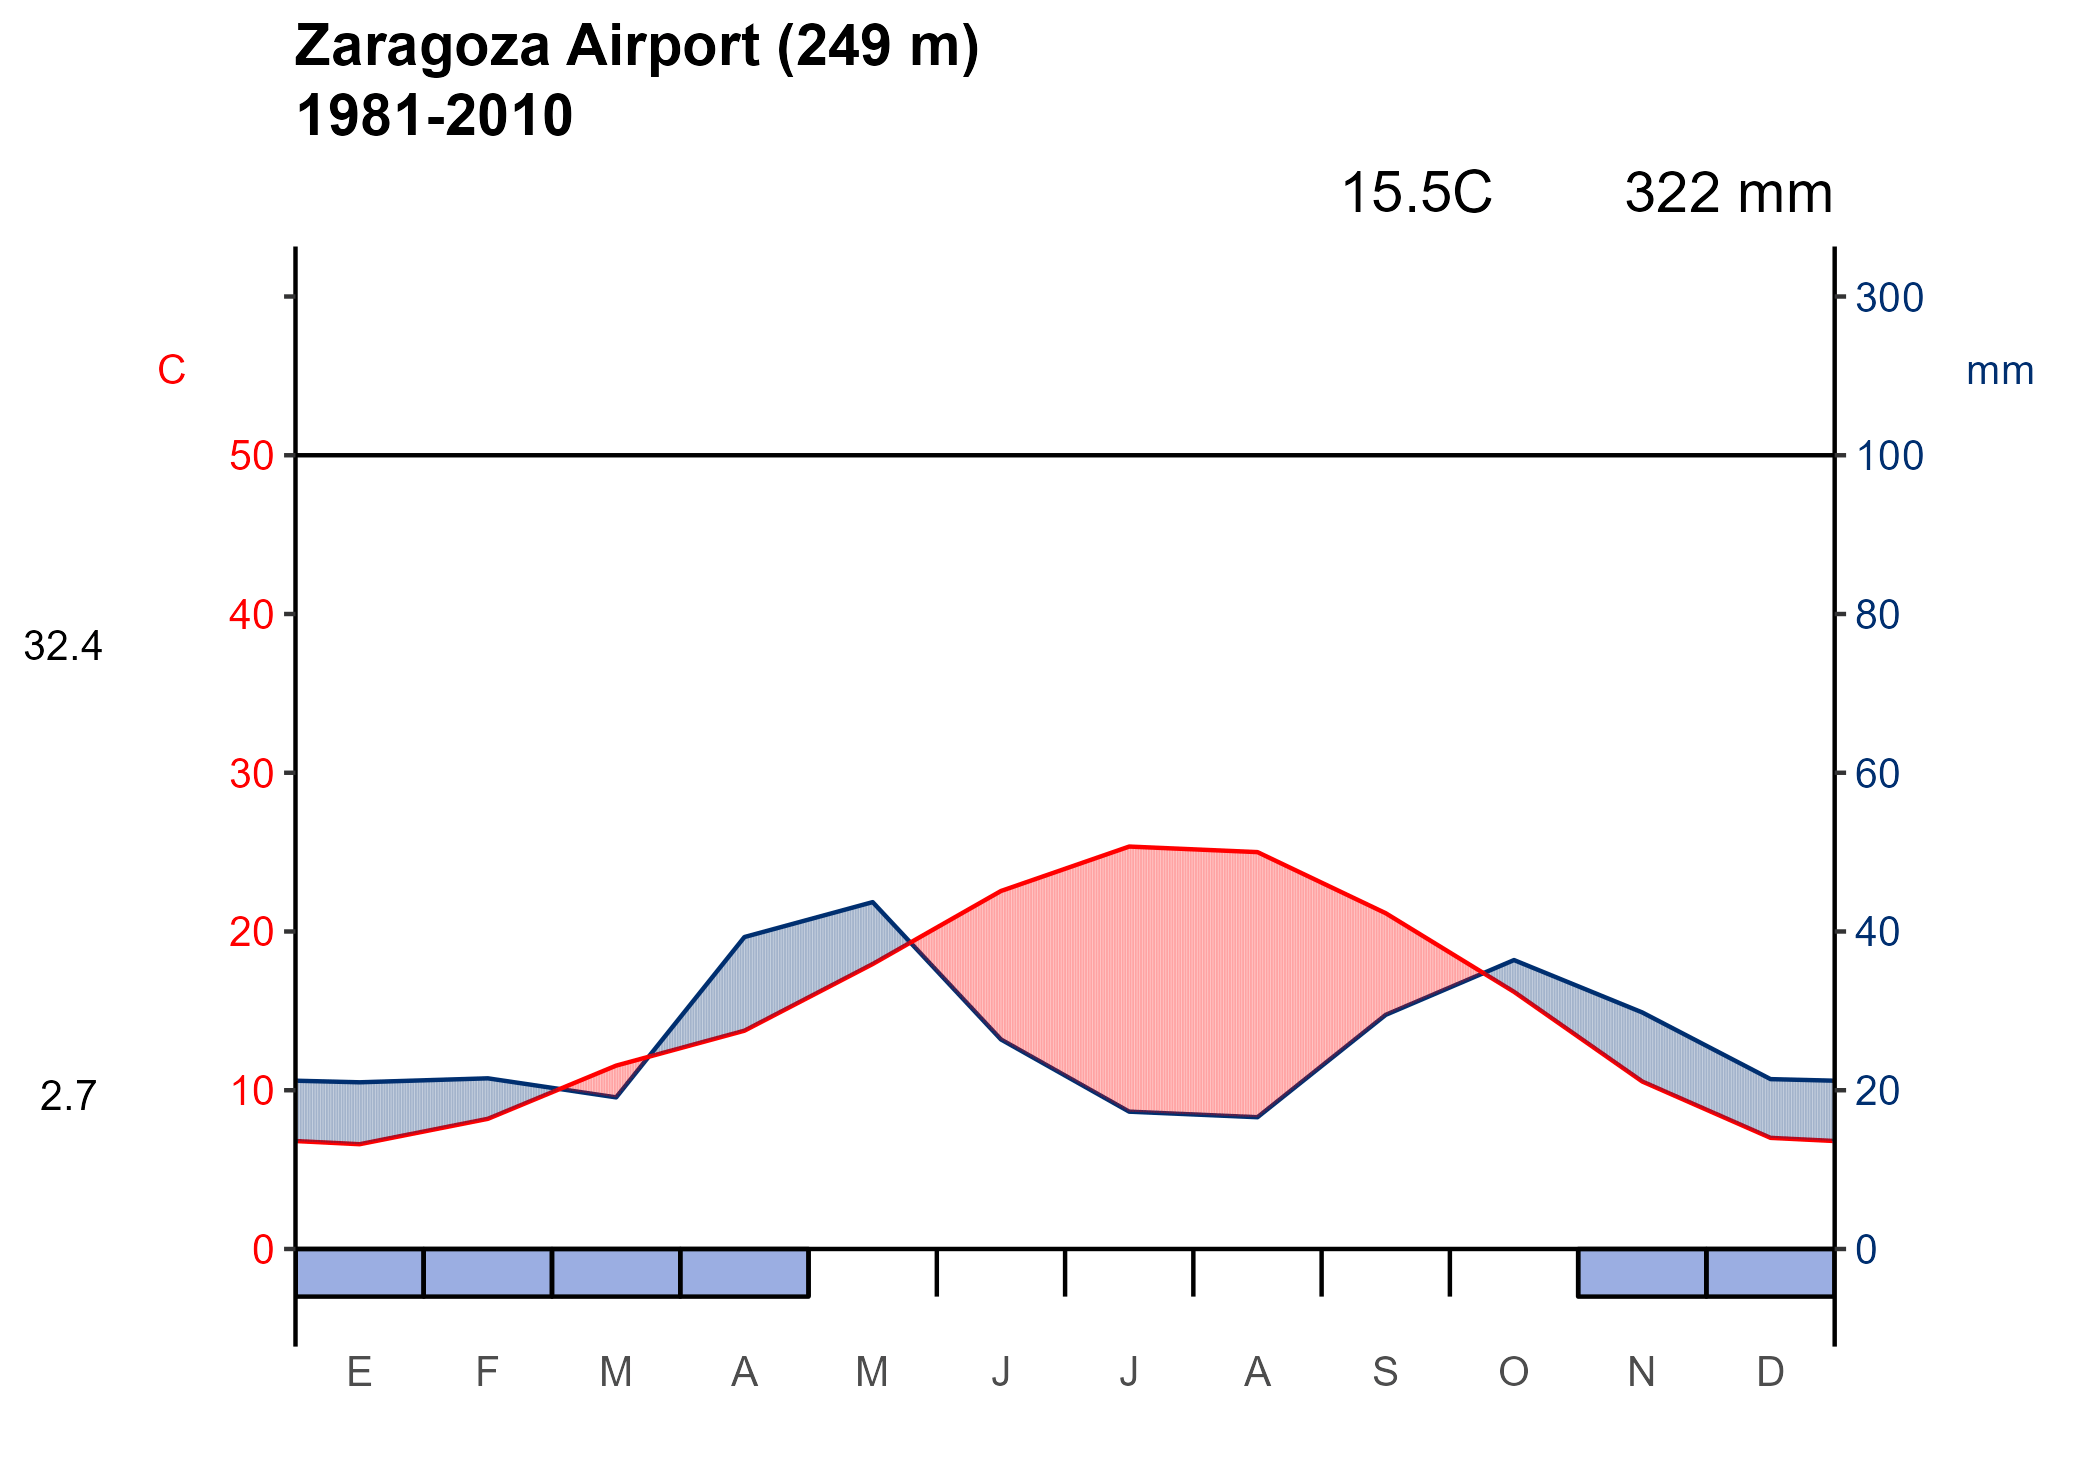
You can also create a Walter-Lieth climate diagram for a weather station over a specified period:
# Plot a Walter-Lieth climate diagram for a weather station.

# Load example data.
wl_data <- climaemet::climaemet_9434_climatogram

ggclimat_walter_lieth(
  wl_data,
  alt = "249",
  per = "1981-2010",
  est = "Zaragoza Airport"
)
You can also create a wind rose from wind speed and direction data recorded at weather stations.
# Plot a wind rose for a weather station.

# Load example data.
wind_data <- climaemet::climaemet_9434_wind

speed <- wind_data$velmedia
direction <- wind_data$dir

ggwindrose(
  speed = speed,
  direction = direction,
  speed_cuts = seq(0, 16, 4),
  legend_title = "Wind speed (m/s)",
  calm_wind = 0,
  n_col = 1,
  plot_title = "Zaragoza Airport"
) +
  labs(subtitle = "2000-2020", caption = "Source: AEMET")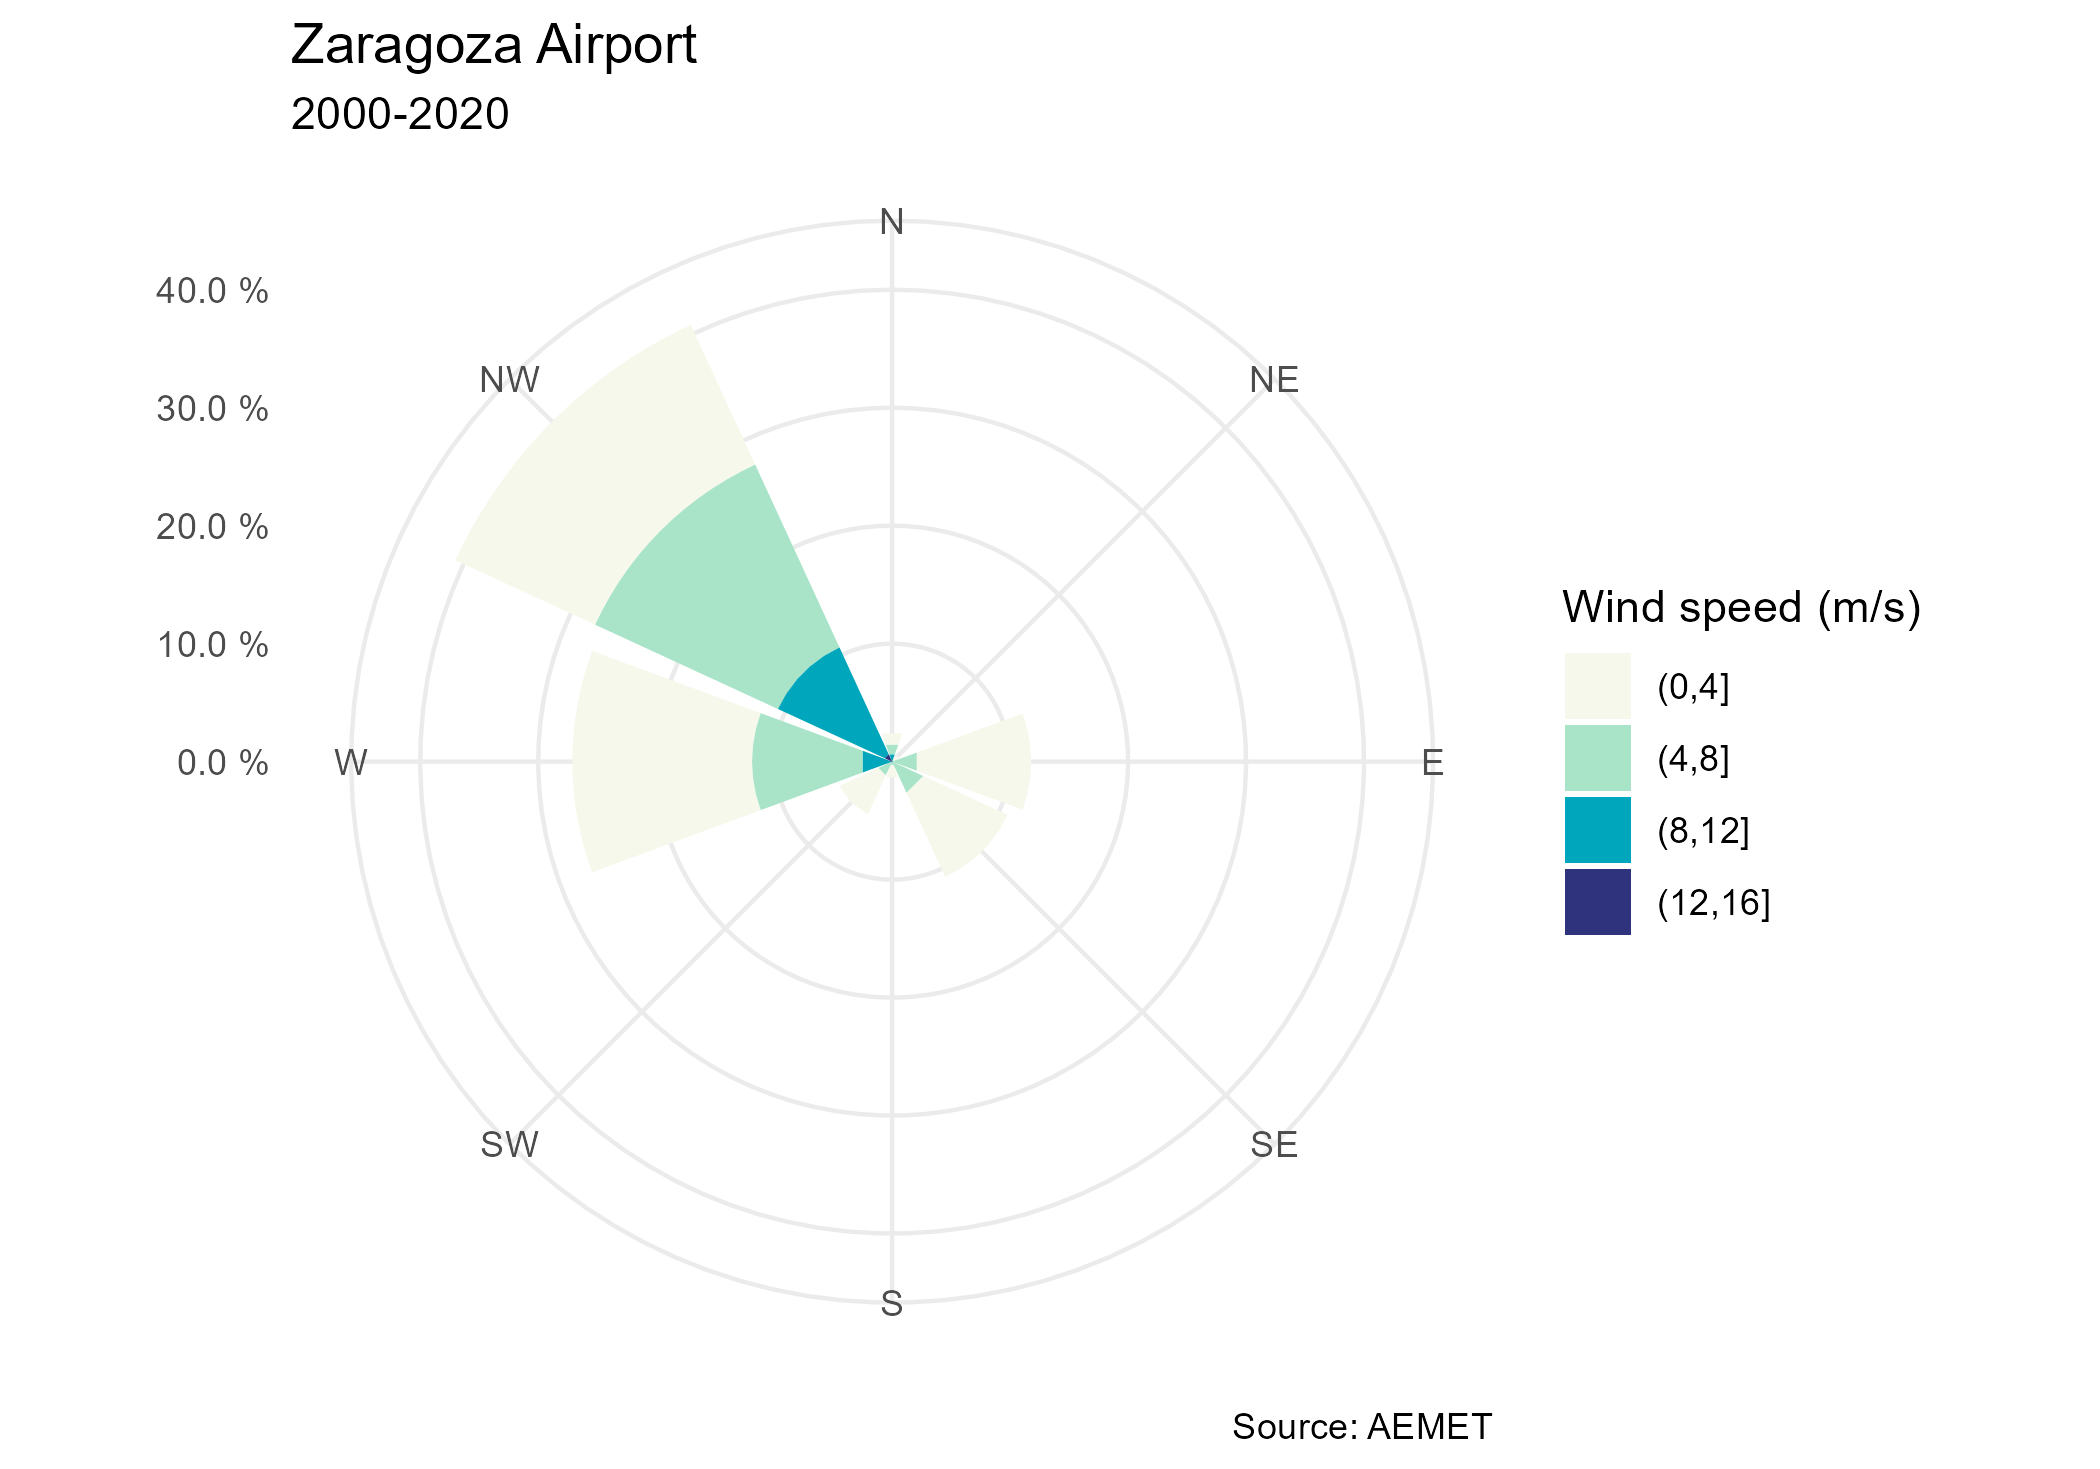
Code of conduct
This project is released with a Contributor Code of Conduct. By participating, you agree to abide by its terms.
Citation
If you use climaemet in a paper, please consider citing it:
Pizarro M, Hernangómez D, Fernández-Avilés G (2021). climaemet: Climate AEMET Tools. doi:10.5281/zenodo.5205573.
A BibTeX entry for LaTeX users is:
@Manual{10261_250390,
  author = {Manuel Pizarro and Diego Hernangómez and Gema Fernández-Avilés},
  title = {{climaemet}: Climate {AEMET} Tools},
  year = {2021},
  abstract = {The goal of climaemet is to serve as an interface to download the climatic data of the Spanish Meteorological Agency (AEMET) directly from R using their API (https://opendata.aemet.es/) and create scientific graphs (climate charts, trend analysis of climate time series, temperature and precipitation anomalies maps, “warming stripes” graphics, climatograms, etc.).},
  doi = {10.5281/zenodo.5205573},
}
Links
- Download climaemet from https://cran.r-project.org/package=climaemet.
- Browse the source code at https://github.com/ropenspain/climaemet.