Create an sf POLYGON or LINESTRING that can mark or
frame the Canary Islands when they are displayed as an inset on maps of
Spain. This object is useful together with esp_move_can() and the
moveCAN arguments available in other mapSpain getters.
esp_get_can_provinces() returns a small LINESTRING used to mark the
separator between the two provinces of the Canary Islands. This helper is
intended for cartographic use when composing inset maps of Spain.
Usage
esp_get_can_box(
  style = c("right", "left", "box", "poly"),
  moveCAN = TRUE,
  epsg = 4258
)

esp_get_can_provinces(moveCAN = TRUE, epsg = "4258")
Source
Coordinates of esp_get_can_provinces() derived from CartoBase ANE
(se89_mult_admin_provcan_l.shp).
Arguments
- style
Character string. One of
"right","left","box"or"poly". Default is"right", see Details.- moveCAN
A logical
TRUE/FALSEor a vector of coordinatesc(lat, lon). It places the Canary Islands close to Spain's mainland. Initial position can be adjusted using the vector of coordinates. See Displacing the Canary Islands inesp_move_can().- epsg
Character string or number. Projection of the map: 4-digit EPSG code. One of:
"4258": ETRS89."4326": WGS84."3035": ETRS89 / ETRS-LAEA."3857": Pseudo-Mercator.
Value
An sf object: a POLYGON (when style = "poly") or a
LINESTRING (other styles).
Details
The style parameter controls the geometry returned:
"box": a rectangular boundary returned as aLINESTRING."poly": a slightly expanded rectangle returned as a filledPOLYGON."left"/"right": decorativeLINESTRINGvariants that follow the western or eastern side of the islands respectively.
See also
Helpers for Canary Islands insets and displacement:
esp_move_can()
Examples
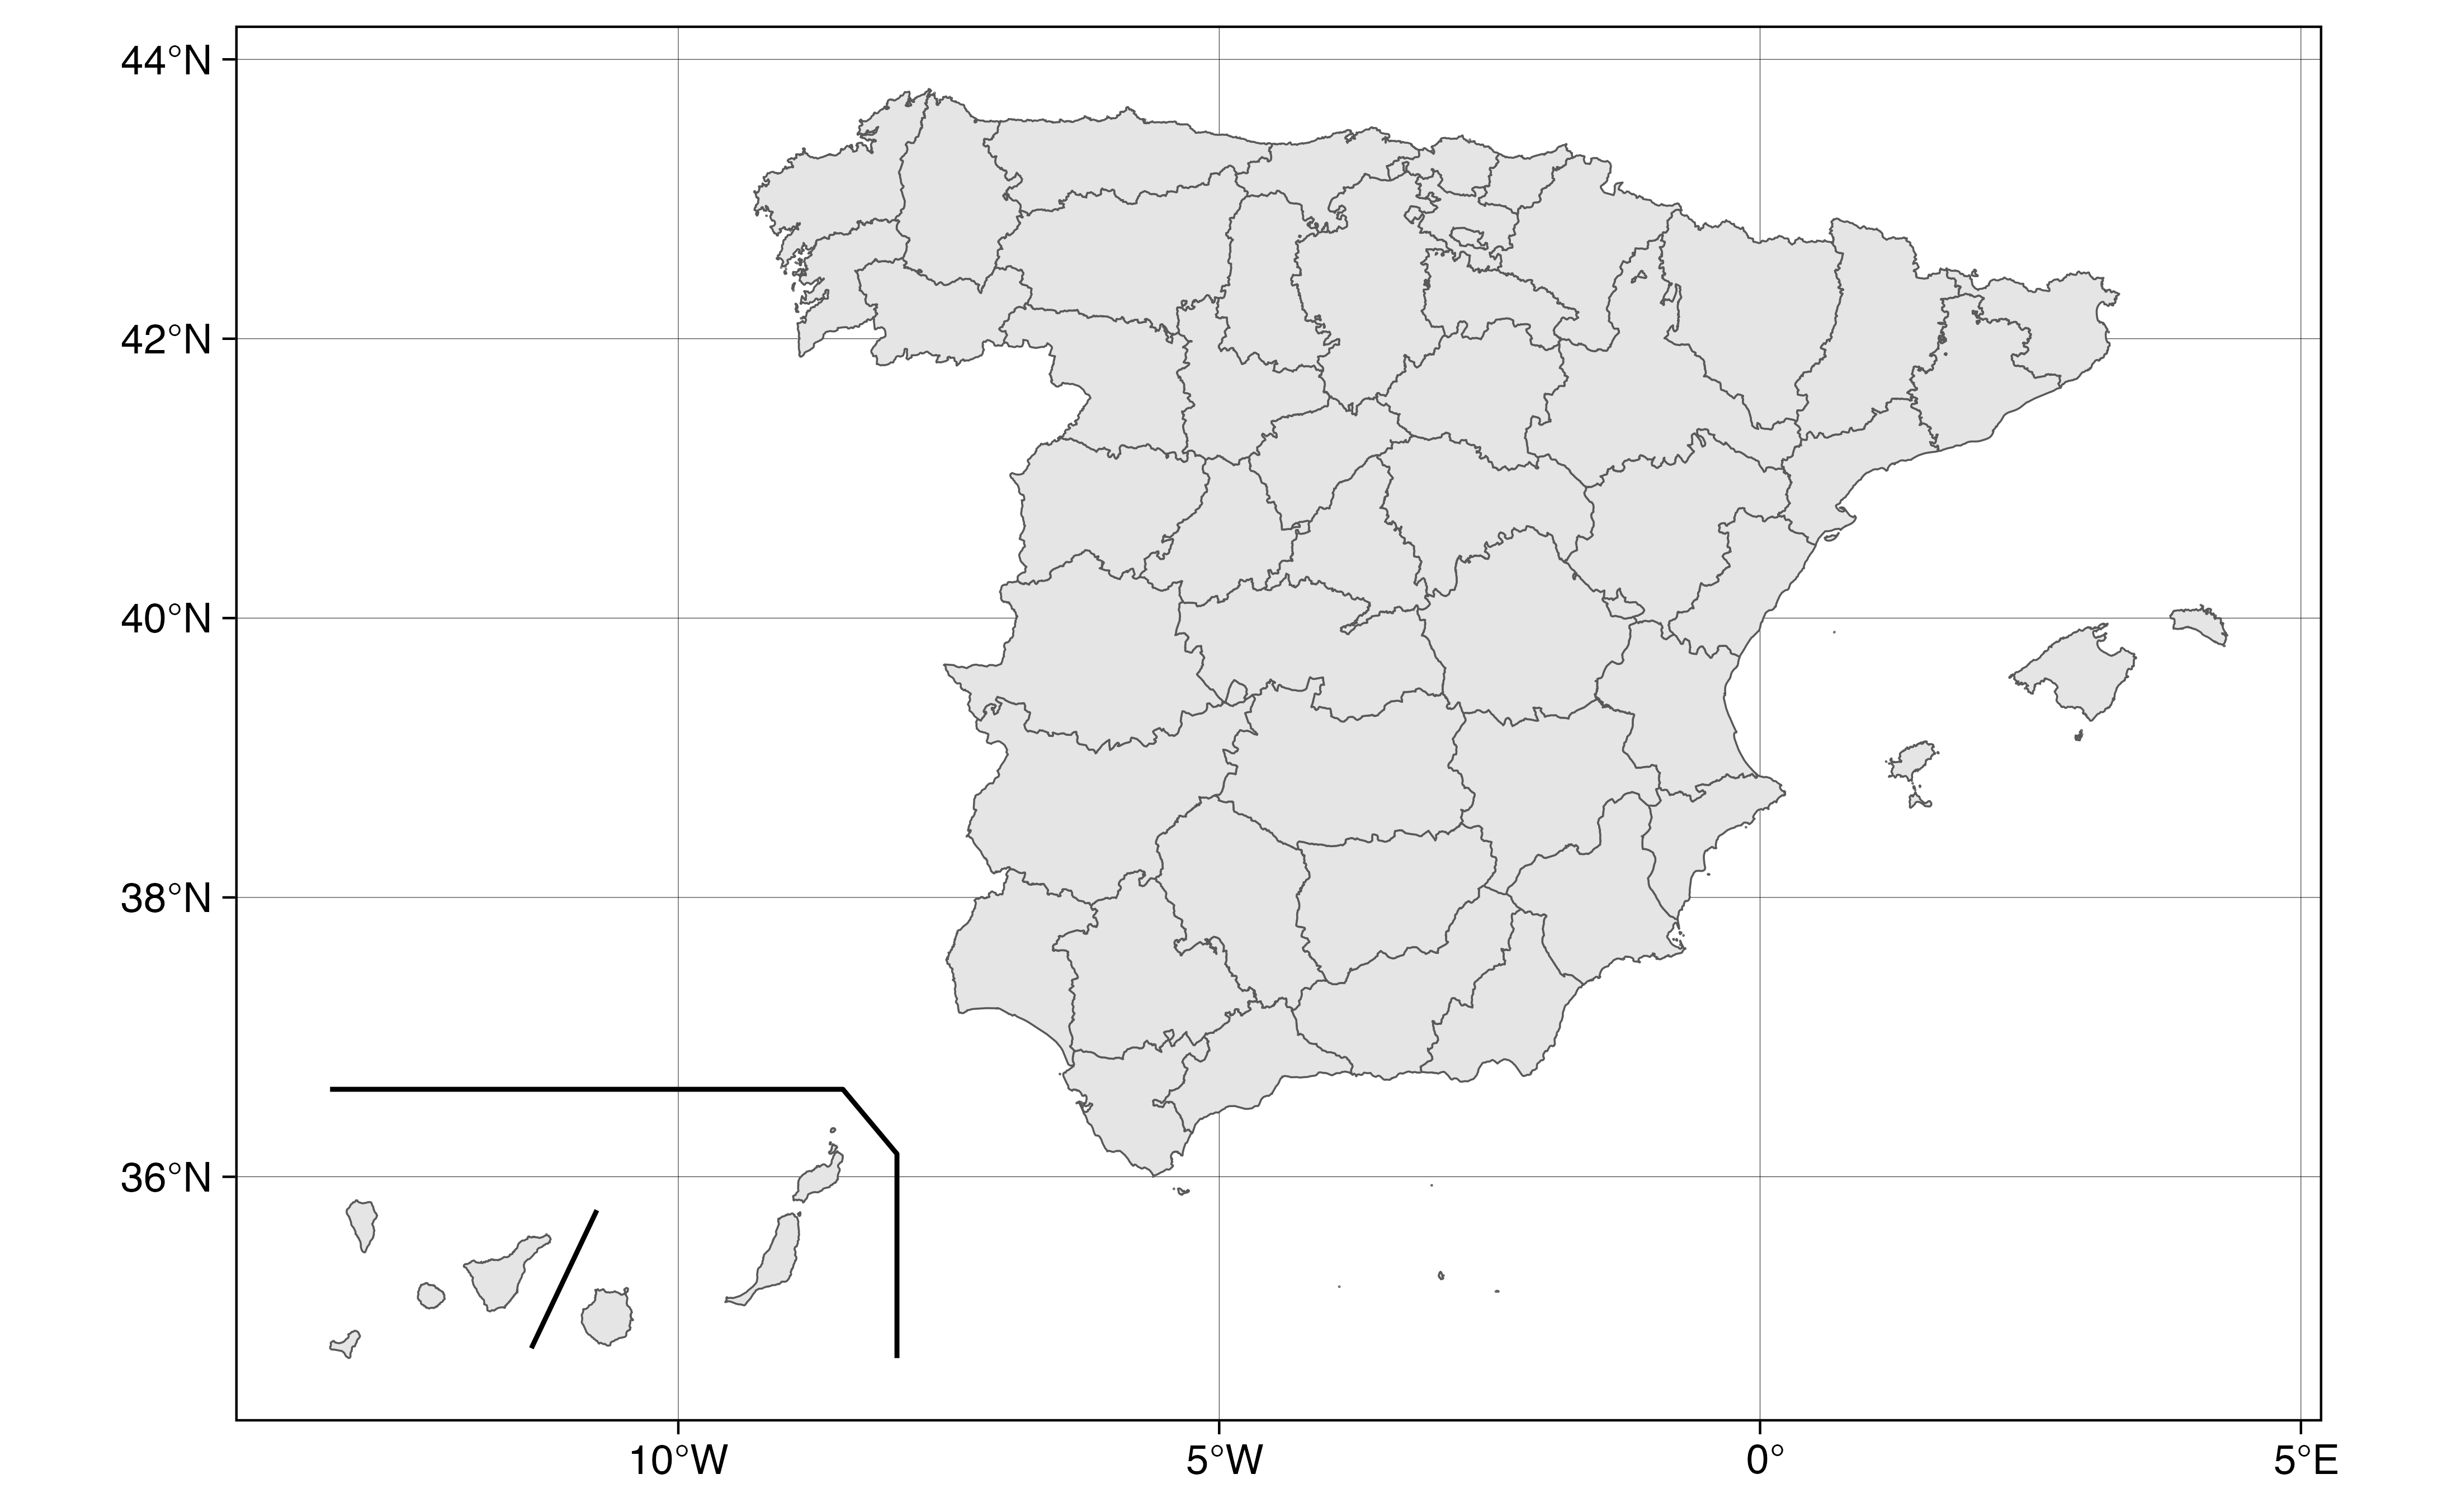
provs <- esp_get_prov()
box <- esp_get_can_box()
line <- esp_get_can_provinces()
library(ggplot2)
ggplot(provs) +
geom_sf() +
geom_sf(data = box, linewidth = 0.15) +
geom_sf(data = line, linewidth = 0.15) +
theme_linedraw()
 # \donttest{
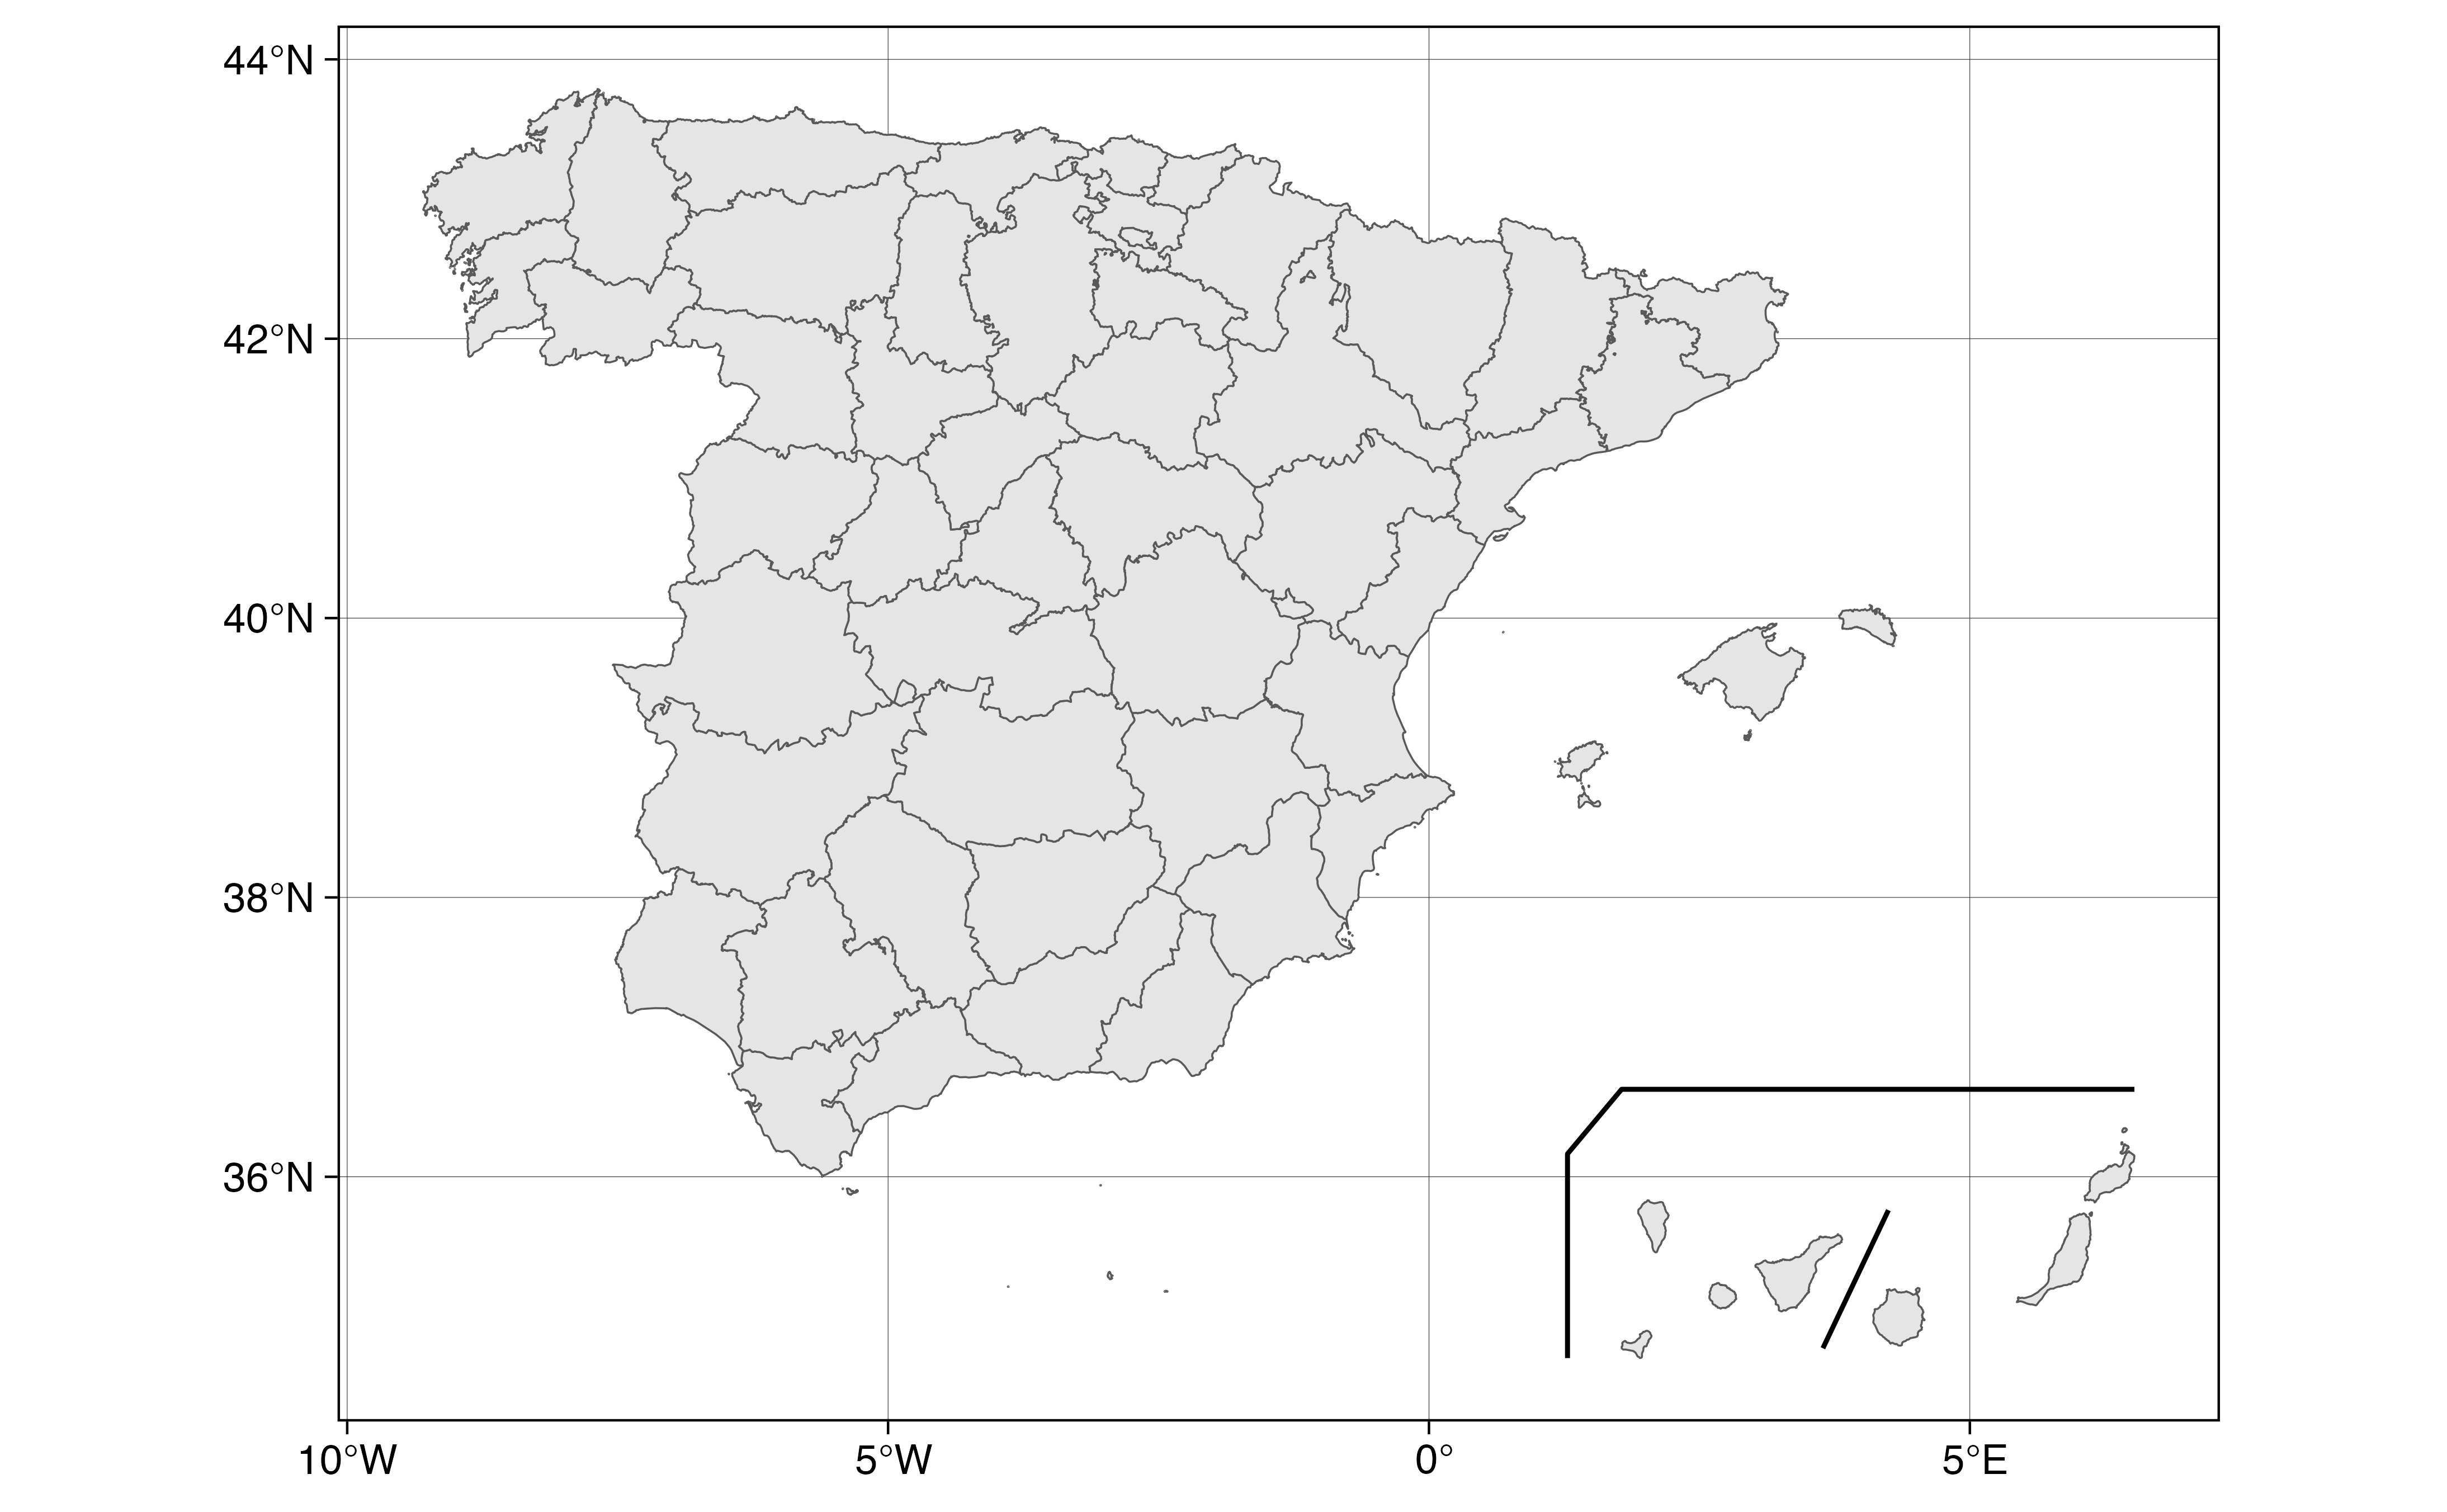
# Displacing the Canary Islands by a custom offset.
displace <- c(15, 0)
provs_disp <- esp_get_prov(moveCAN = displace)
box_disp <- esp_get_can_box(style = "left", moveCAN = displace)
line_disp <- esp_get_can_provinces(moveCAN = displace)
ggplot(provs_disp) +
geom_sf() +
geom_sf(data = box_disp, linewidth = 0.15) +
geom_sf(data = line_disp, linewidth = 0.15) +
theme_linedraw()
# \donttest{
# Displacing the Canary Islands by a custom offset.
displace <- c(15, 0)
provs_disp <- esp_get_prov(moveCAN = displace)
box_disp <- esp_get_can_box(style = "left", moveCAN = displace)
line_disp <- esp_get_can_provinces(moveCAN = displace)
ggplot(provs_disp) +
geom_sf() +
geom_sf(data = box_disp, linewidth = 0.15) +
geom_sf(data = line_disp, linewidth = 0.15) +
theme_linedraw()
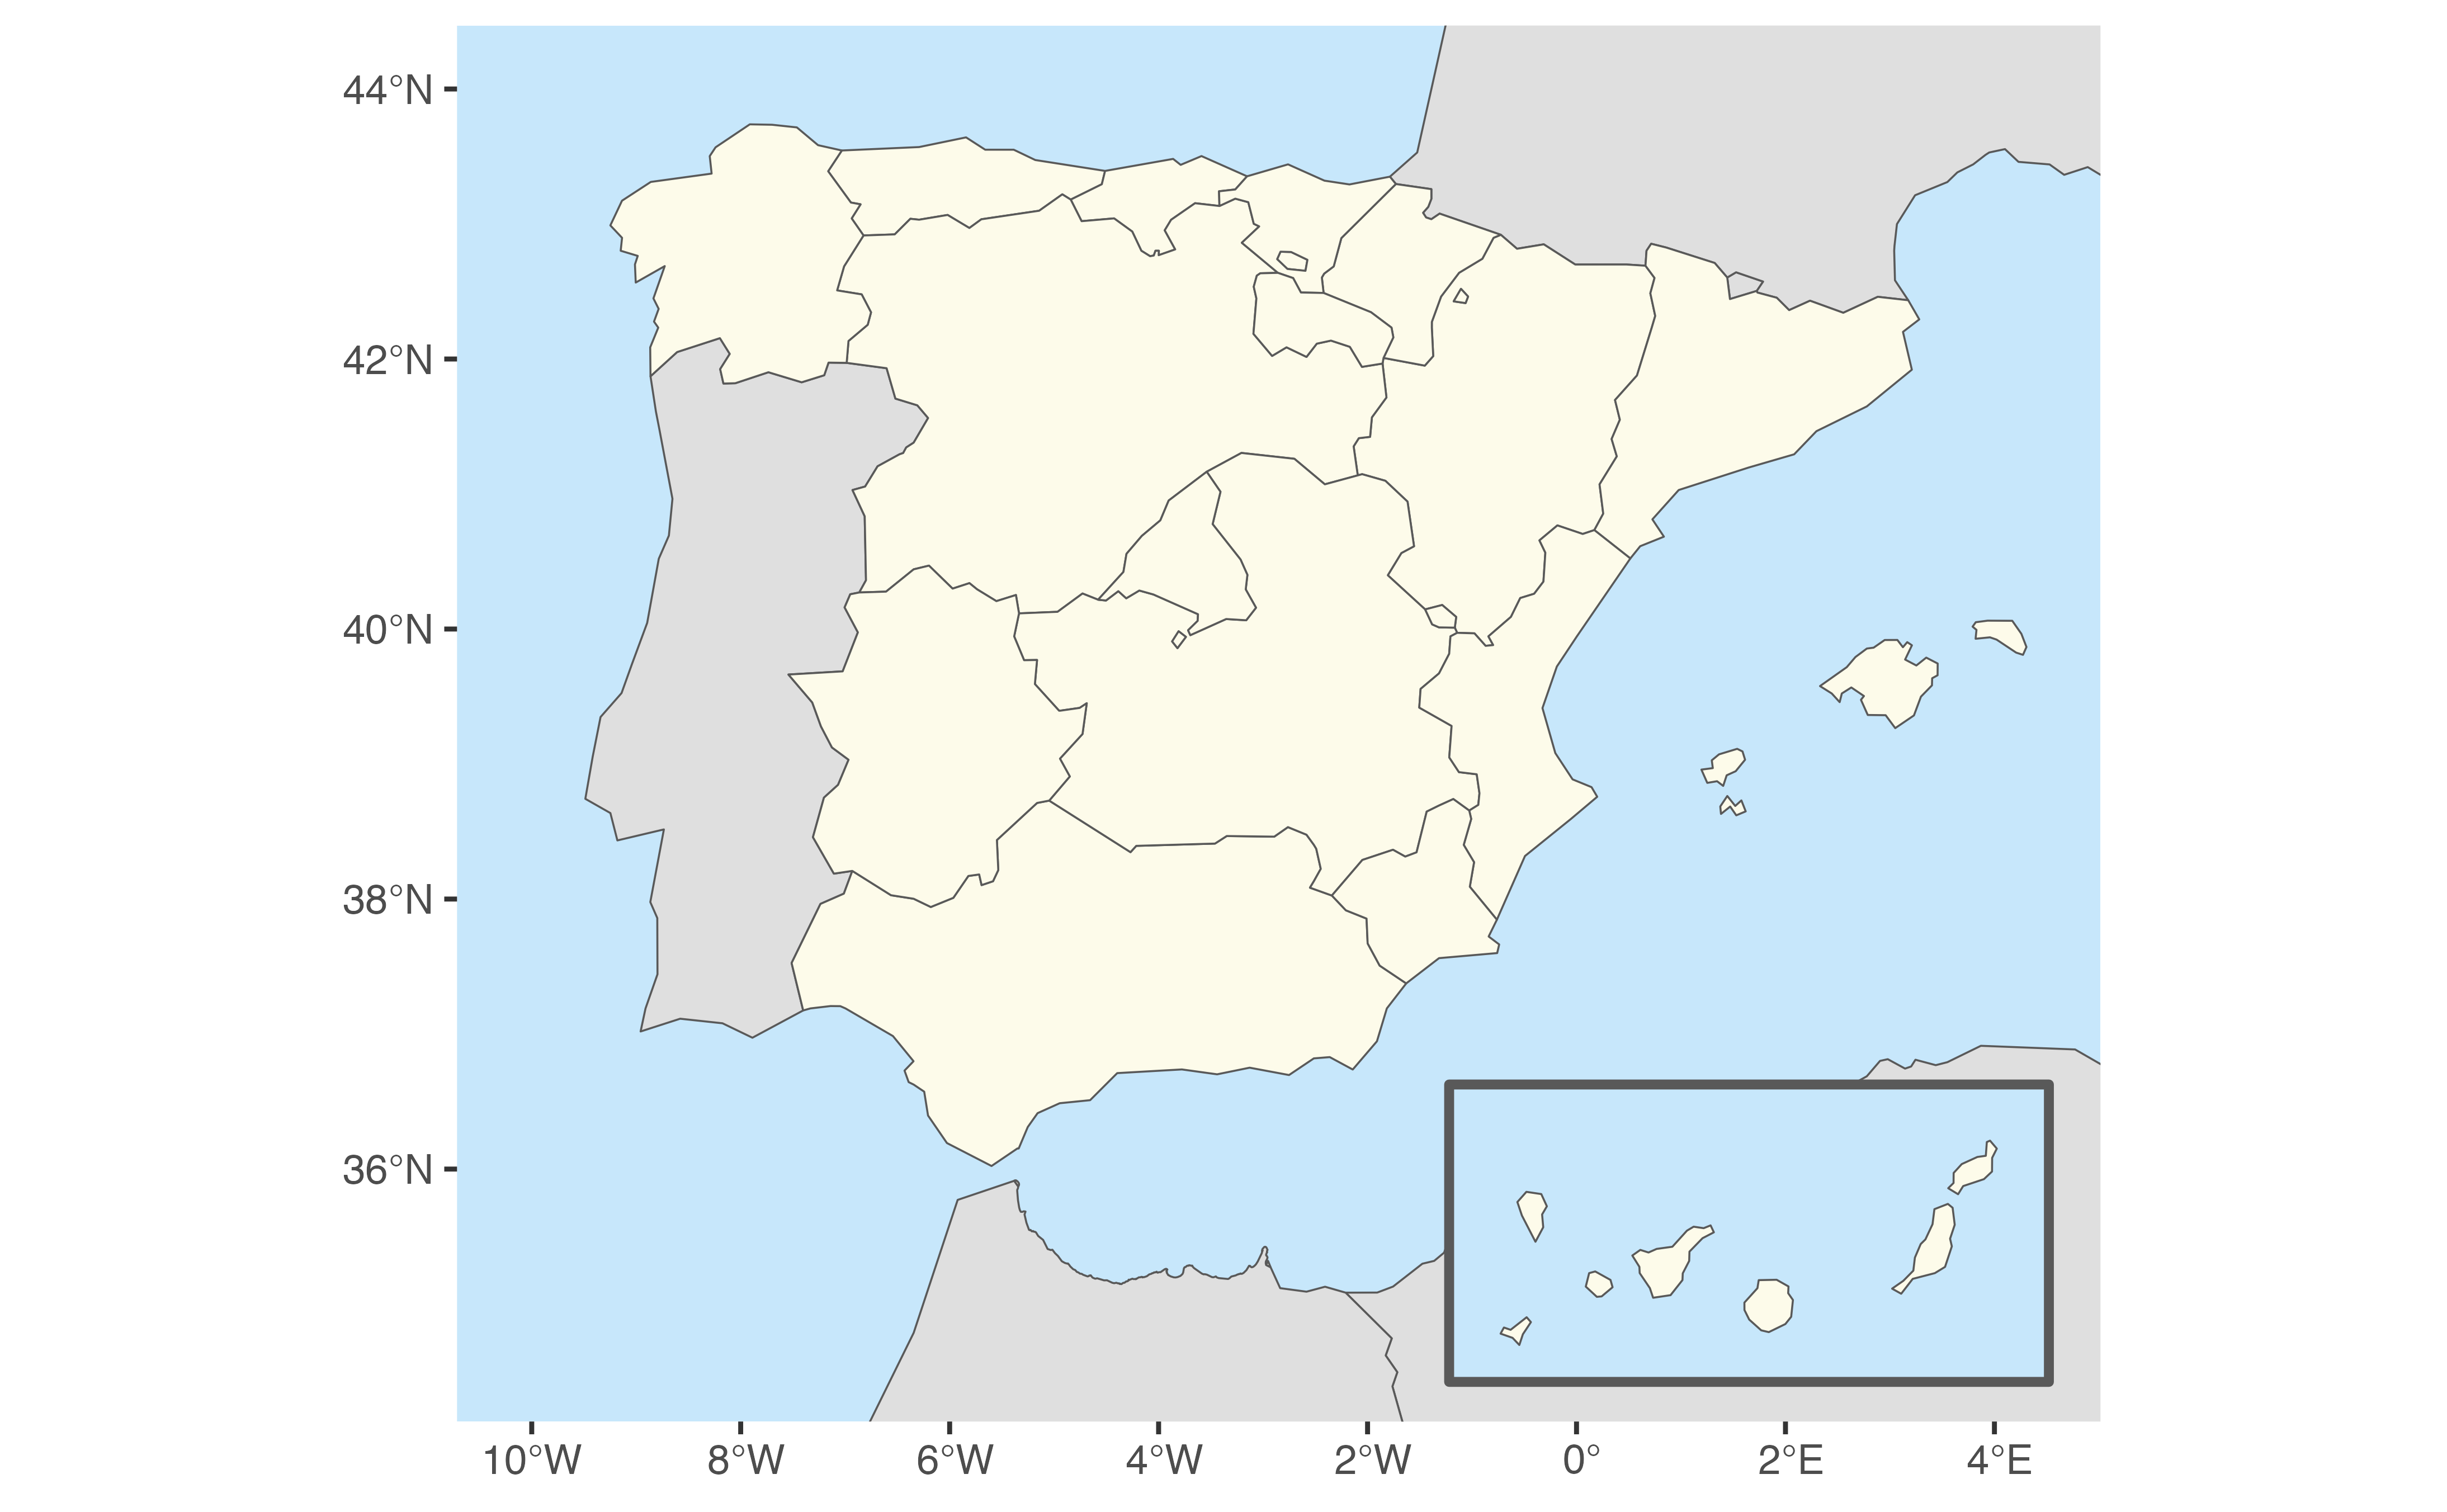
 # Example using the polygon style together with other layers.
library(giscoR)
res <- "20"
countries <- gisco_get_countries(
res = res, epsg = "4326",
country = c("France", "Portugal", "Andorra", "Morocco", "Argelia")
)
can_box <- esp_get_can_box(
style = "poly", epsg = "4326",
moveCAN = c(12.5, 0)
)
ccaa <- esp_get_ccaa(res = res, epsg = "4326", moveCAN = c(12.5, 0))
ggplot(countries) +
geom_sf(fill = "#DFDFDF") +
geom_sf(data = can_box, fill = "#C7E7FB", linewidth = 1) +
geom_sf(data = ccaa, fill = "#FDFBEA") +
coord_sf(xlim = c(-10, 4.3), ylim = c(34.6, 44)) +
theme(
panel.background = element_rect(fill = "#C7E7FB"),
panel.grid = element_blank()
)
# Example using the polygon style together with other layers.
library(giscoR)
res <- "20"
countries <- gisco_get_countries(
res = res, epsg = "4326",
country = c("France", "Portugal", "Andorra", "Morocco", "Argelia")
)
can_box <- esp_get_can_box(
style = "poly", epsg = "4326",
moveCAN = c(12.5, 0)
)
ccaa <- esp_get_ccaa(res = res, epsg = "4326", moveCAN = c(12.5, 0))
ggplot(countries) +
geom_sf(fill = "#DFDFDF") +
geom_sf(data = can_box, fill = "#C7E7FB", linewidth = 1) +
geom_sf(data = ccaa, fill = "#FDFBEA") +
coord_sf(xlim = c(-10, 4.3), ylim = c(34.6, 44)) +
theme(
panel.background = element_rect(fill = "#C7E7FB"),
panel.grid = element_blank()
)
 # }
# }