
Working with imagery
Diego
Hernangómez

Source: vignettes/articles/working_imagery.Rmd
working_imagery.RmdmapSpain provides a powerful interface for working
with imagery. It can download static files as .png or
.jpeg (depending on the Web Map Service) and use them
alongside your shapefiles.
mapSpain also provides a plugin for the R Leaflet package, which allows adding multiple basemaps to interactive maps.
The services are implemented via the Leaflet plugin leaflet-providersESP. You can view each provider option at that link.
Static tiles
An example showing how to include multiple tiles to create a static map. We focus on layers provided by La Rioja’s Infraestructura de Datos Espaciales (IDERioja).
When working with imagery, set moveCAN = FALSE;
otherwise images for the Canary Islands may be inaccurate.
library(mapSpain)
library(sf)
library(ggplot2)
library(tidyterra)
# Logroño
lgn_borders <- esp_get_munic_siane(munic = "Logroño")
# Convert to Mercator (EPSG:3857) as a general advice when working with tiles
lgn_borders <- st_transform(lgn_borders, 3857)
tile_lgn <- esp_get_tiles(lgn_borders, "IDErioja", bbox_expand = 0.5)
ggplot(lgn_borders) +
geom_spatraster_rgb(data = tile_lgn) +
geom_sf(fill = NA, linewidth = 2, color = "blue")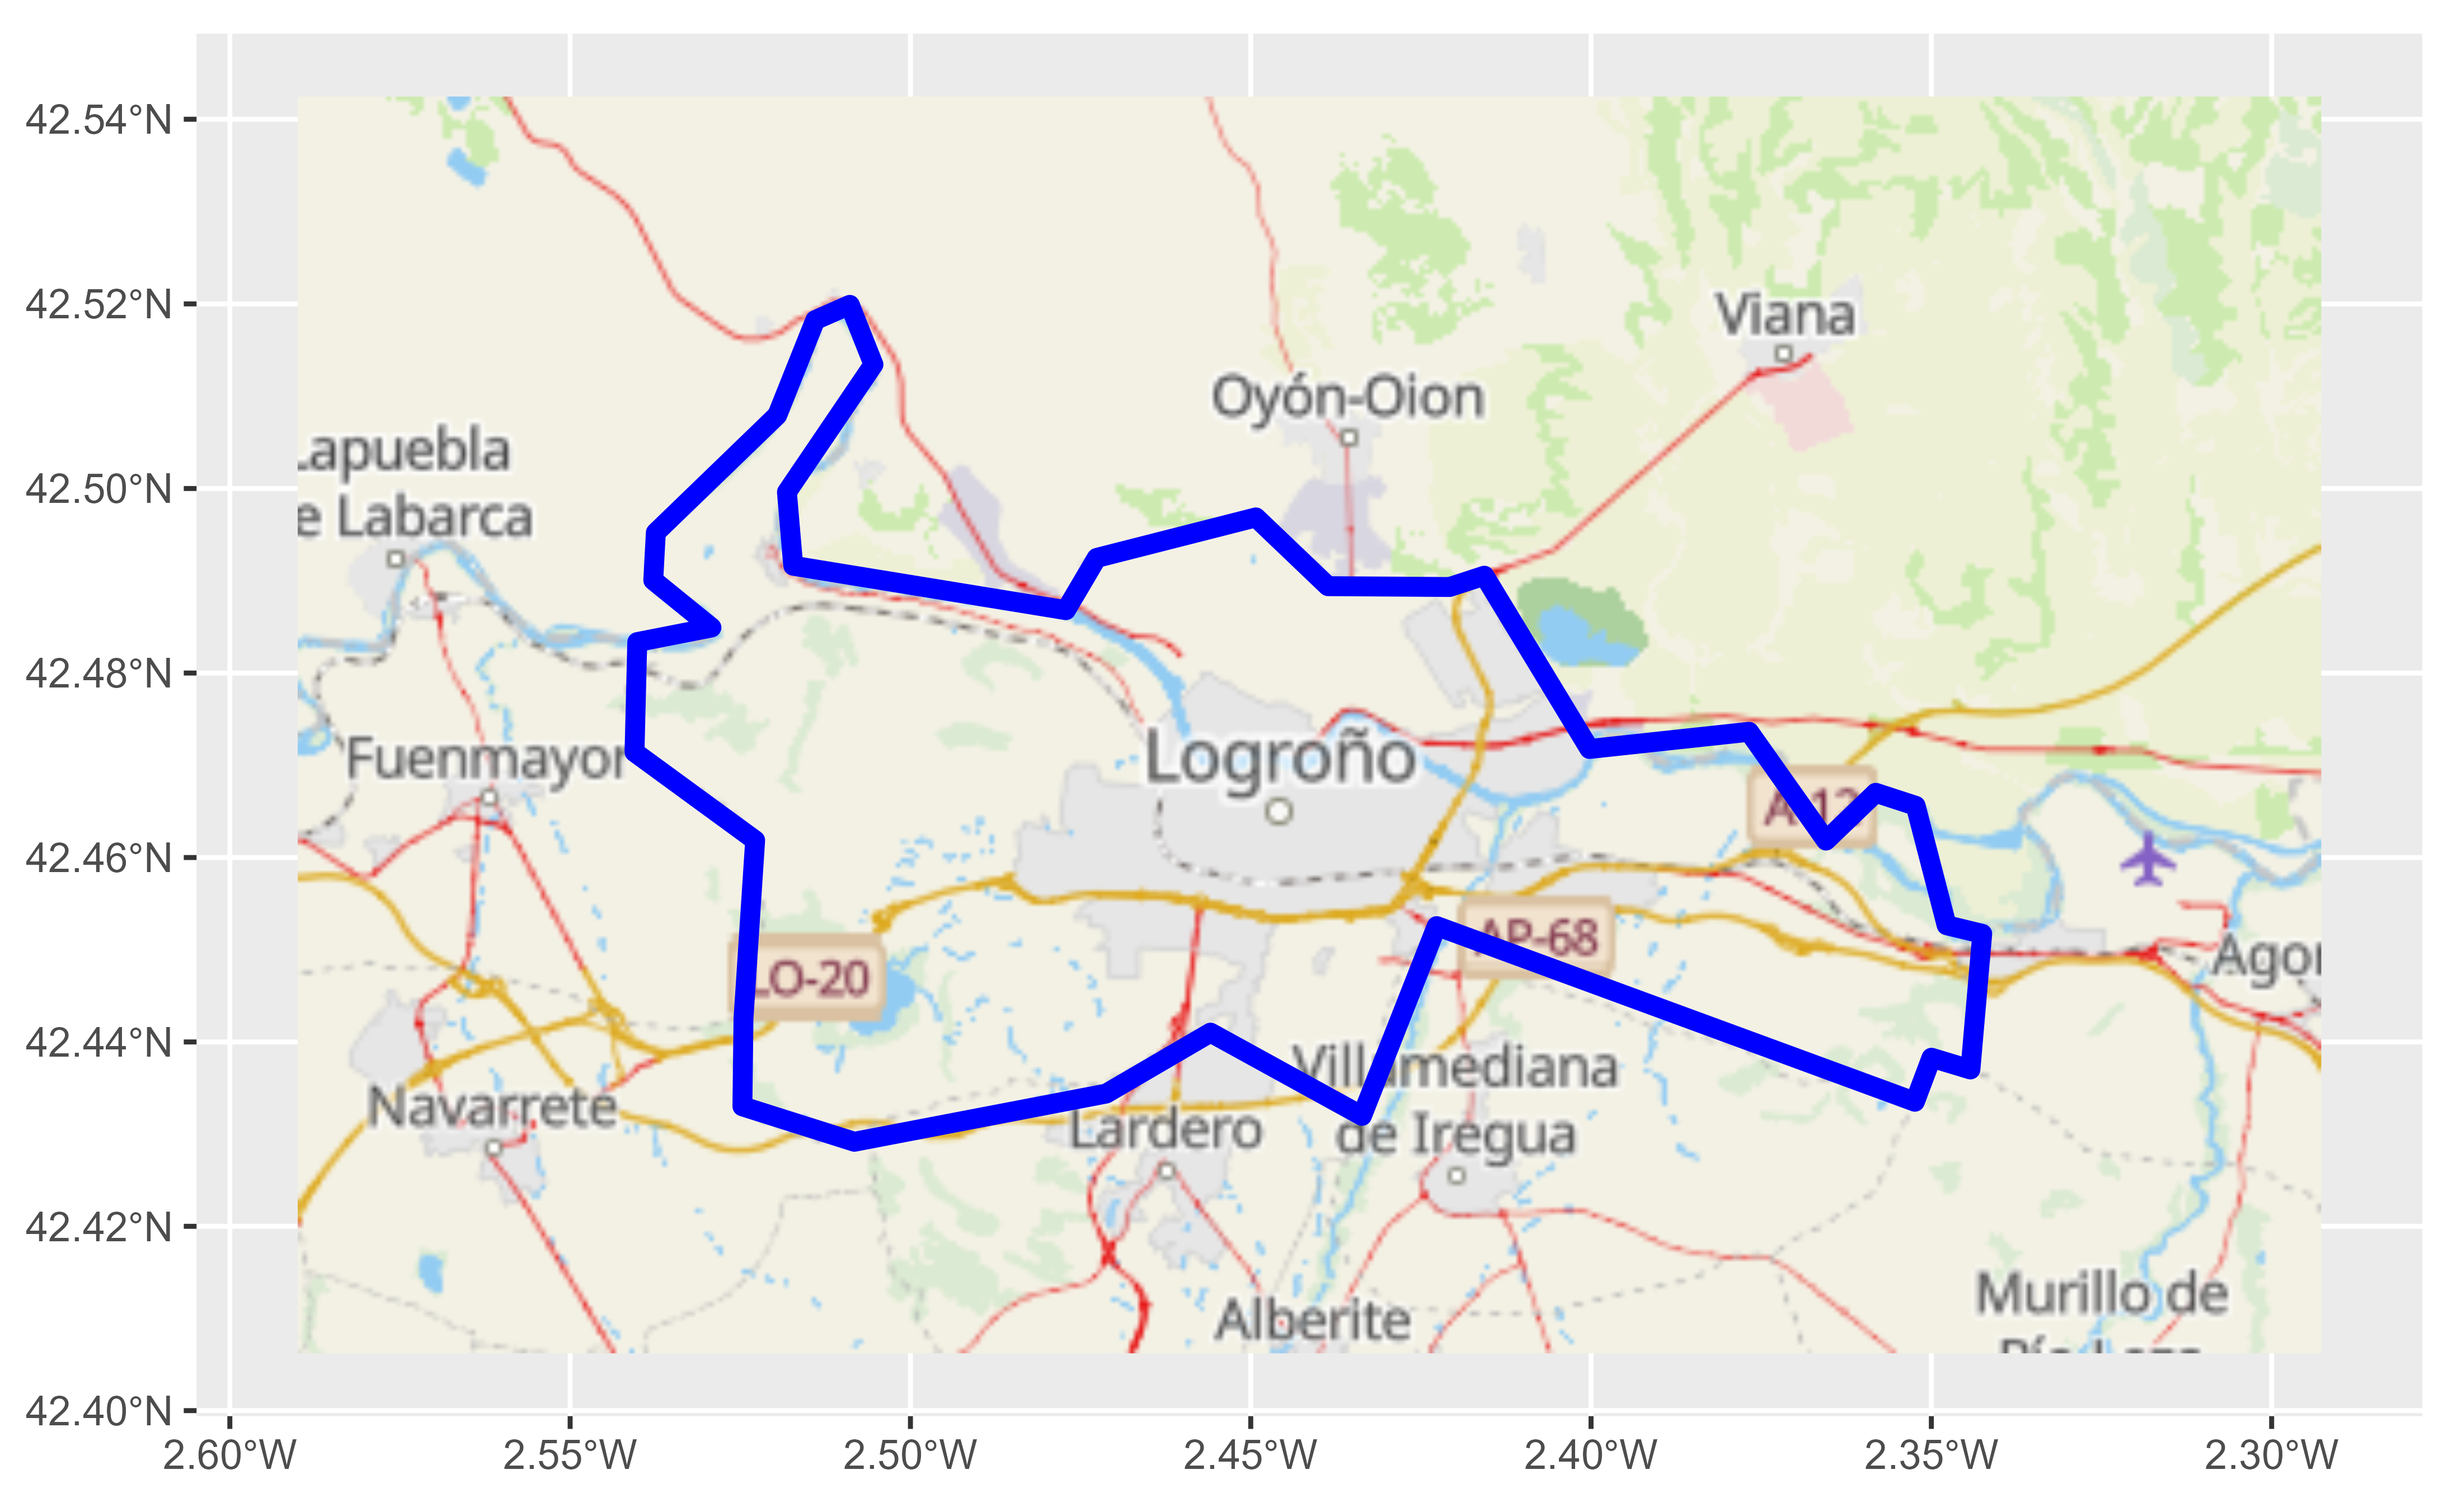
Alpha value on tiles
Some tiles can be loaded with or without an alpha (transparency) value, which controls layer transparency:
madrid <- esp_get_ccaa("Madrid", epsg = 3857)
# Example without transparency
basemap <- esp_get_tiles(madrid, "IDErioja.Claro",
zoommin = 1,
crop = TRUE, bbox_expand = 0
)
tile_opaque <- esp_get_tiles(madrid, "RedTransporte.Carreteras",
transparent = FALSE, crop = TRUE, bbox_expand = 0
)
ggplot() +
geom_spatraster_rgb(data = basemap) +
geom_spatraster_rgb(data = tile_opaque) +
theme_void()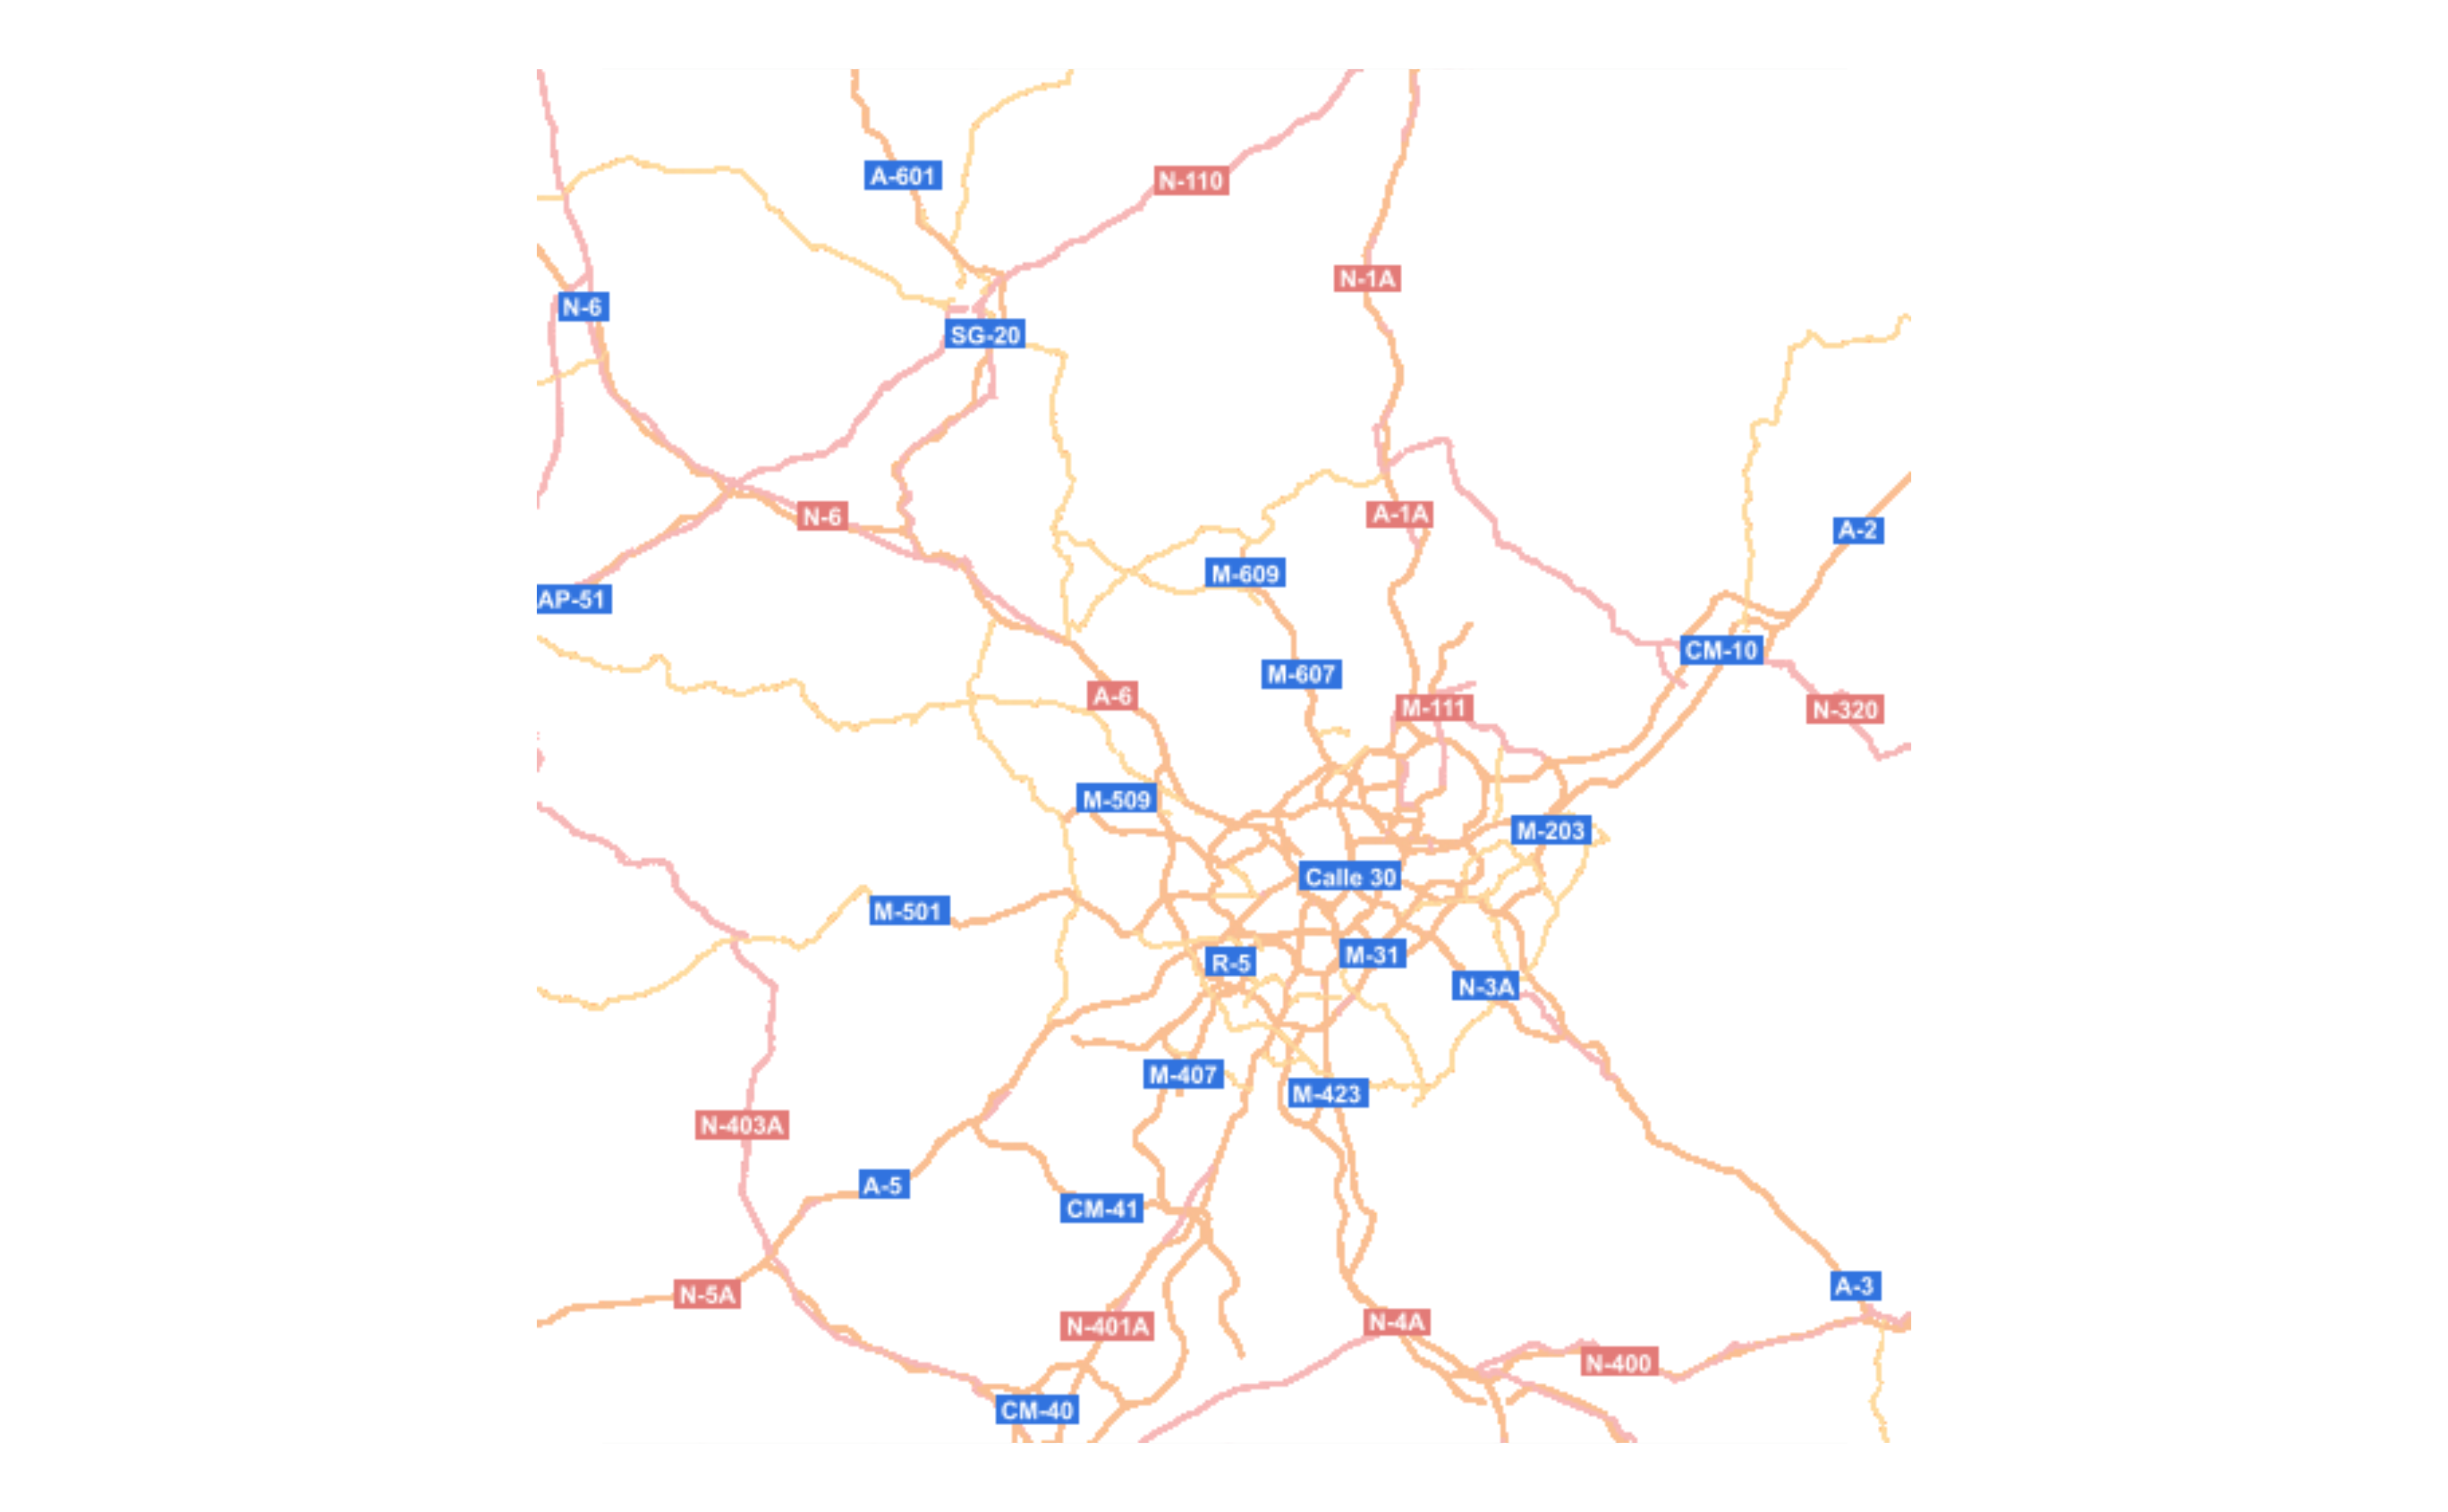
Now let’s check the same code using the
transparent = TRUE option:
# Example with transparency
tile_alpha <- esp_get_tiles(madrid, "RedTransporte.Carreteras",
transparent = TRUE, crop = TRUE, bbox_expand = 0
)
# Same code than above for plotting
ggplot() +
geom_spatraster_rgb(data = basemap) +
geom_spatraster_rgb(data = tile_alpha) +
theme_void()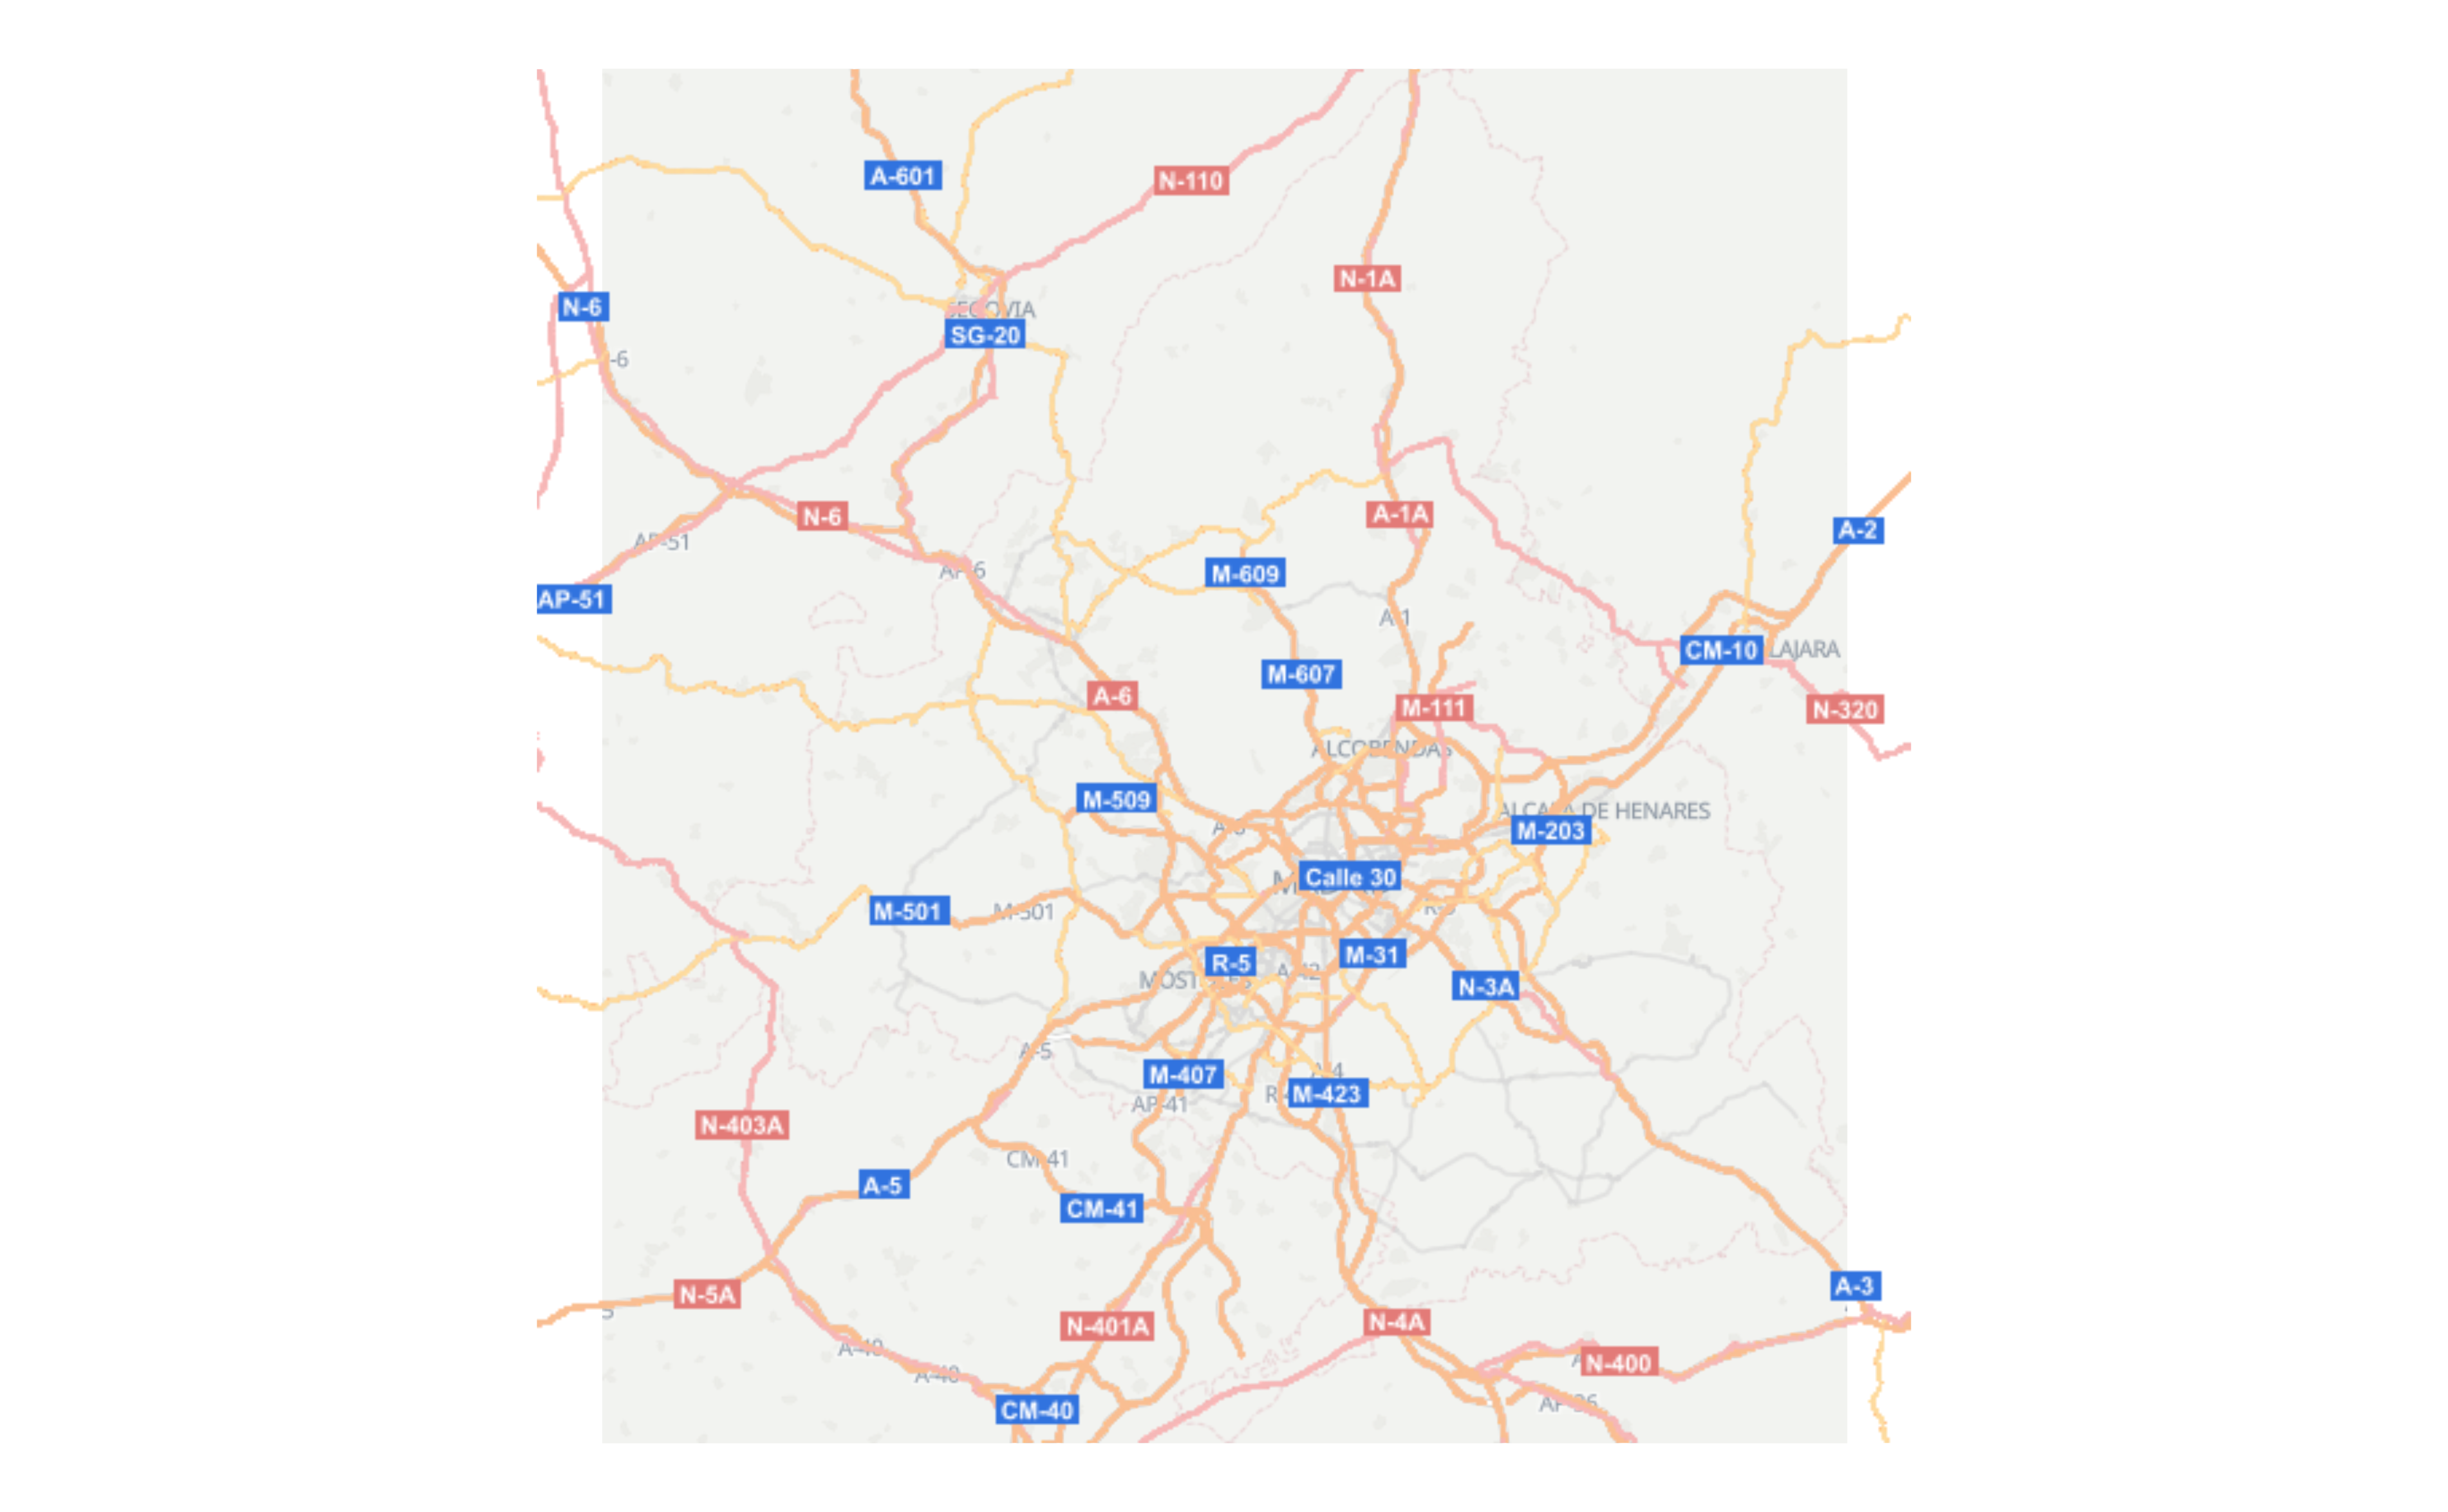
Now the two tiles overlap with the desired transparency.
Masking tiles
Another useful feature is the ability to mask tiles, allowing more advanced maps to be plotted:
rioja <- esp_get_prov("La Rioja", epsg = 3857)
basemap <- esp_get_tiles(rioja, "PNOA", bbox_expand = 0.1, zoommin = 1)
masked <- esp_get_tiles(rioja, "IDErioja", mask = TRUE, zoommin = 1)
ggplot() +
geom_spatraster_rgb(data = basemap, maxcell = 10e6) +
geom_spatraster_rgb(data = masked, maxcell = 10e6)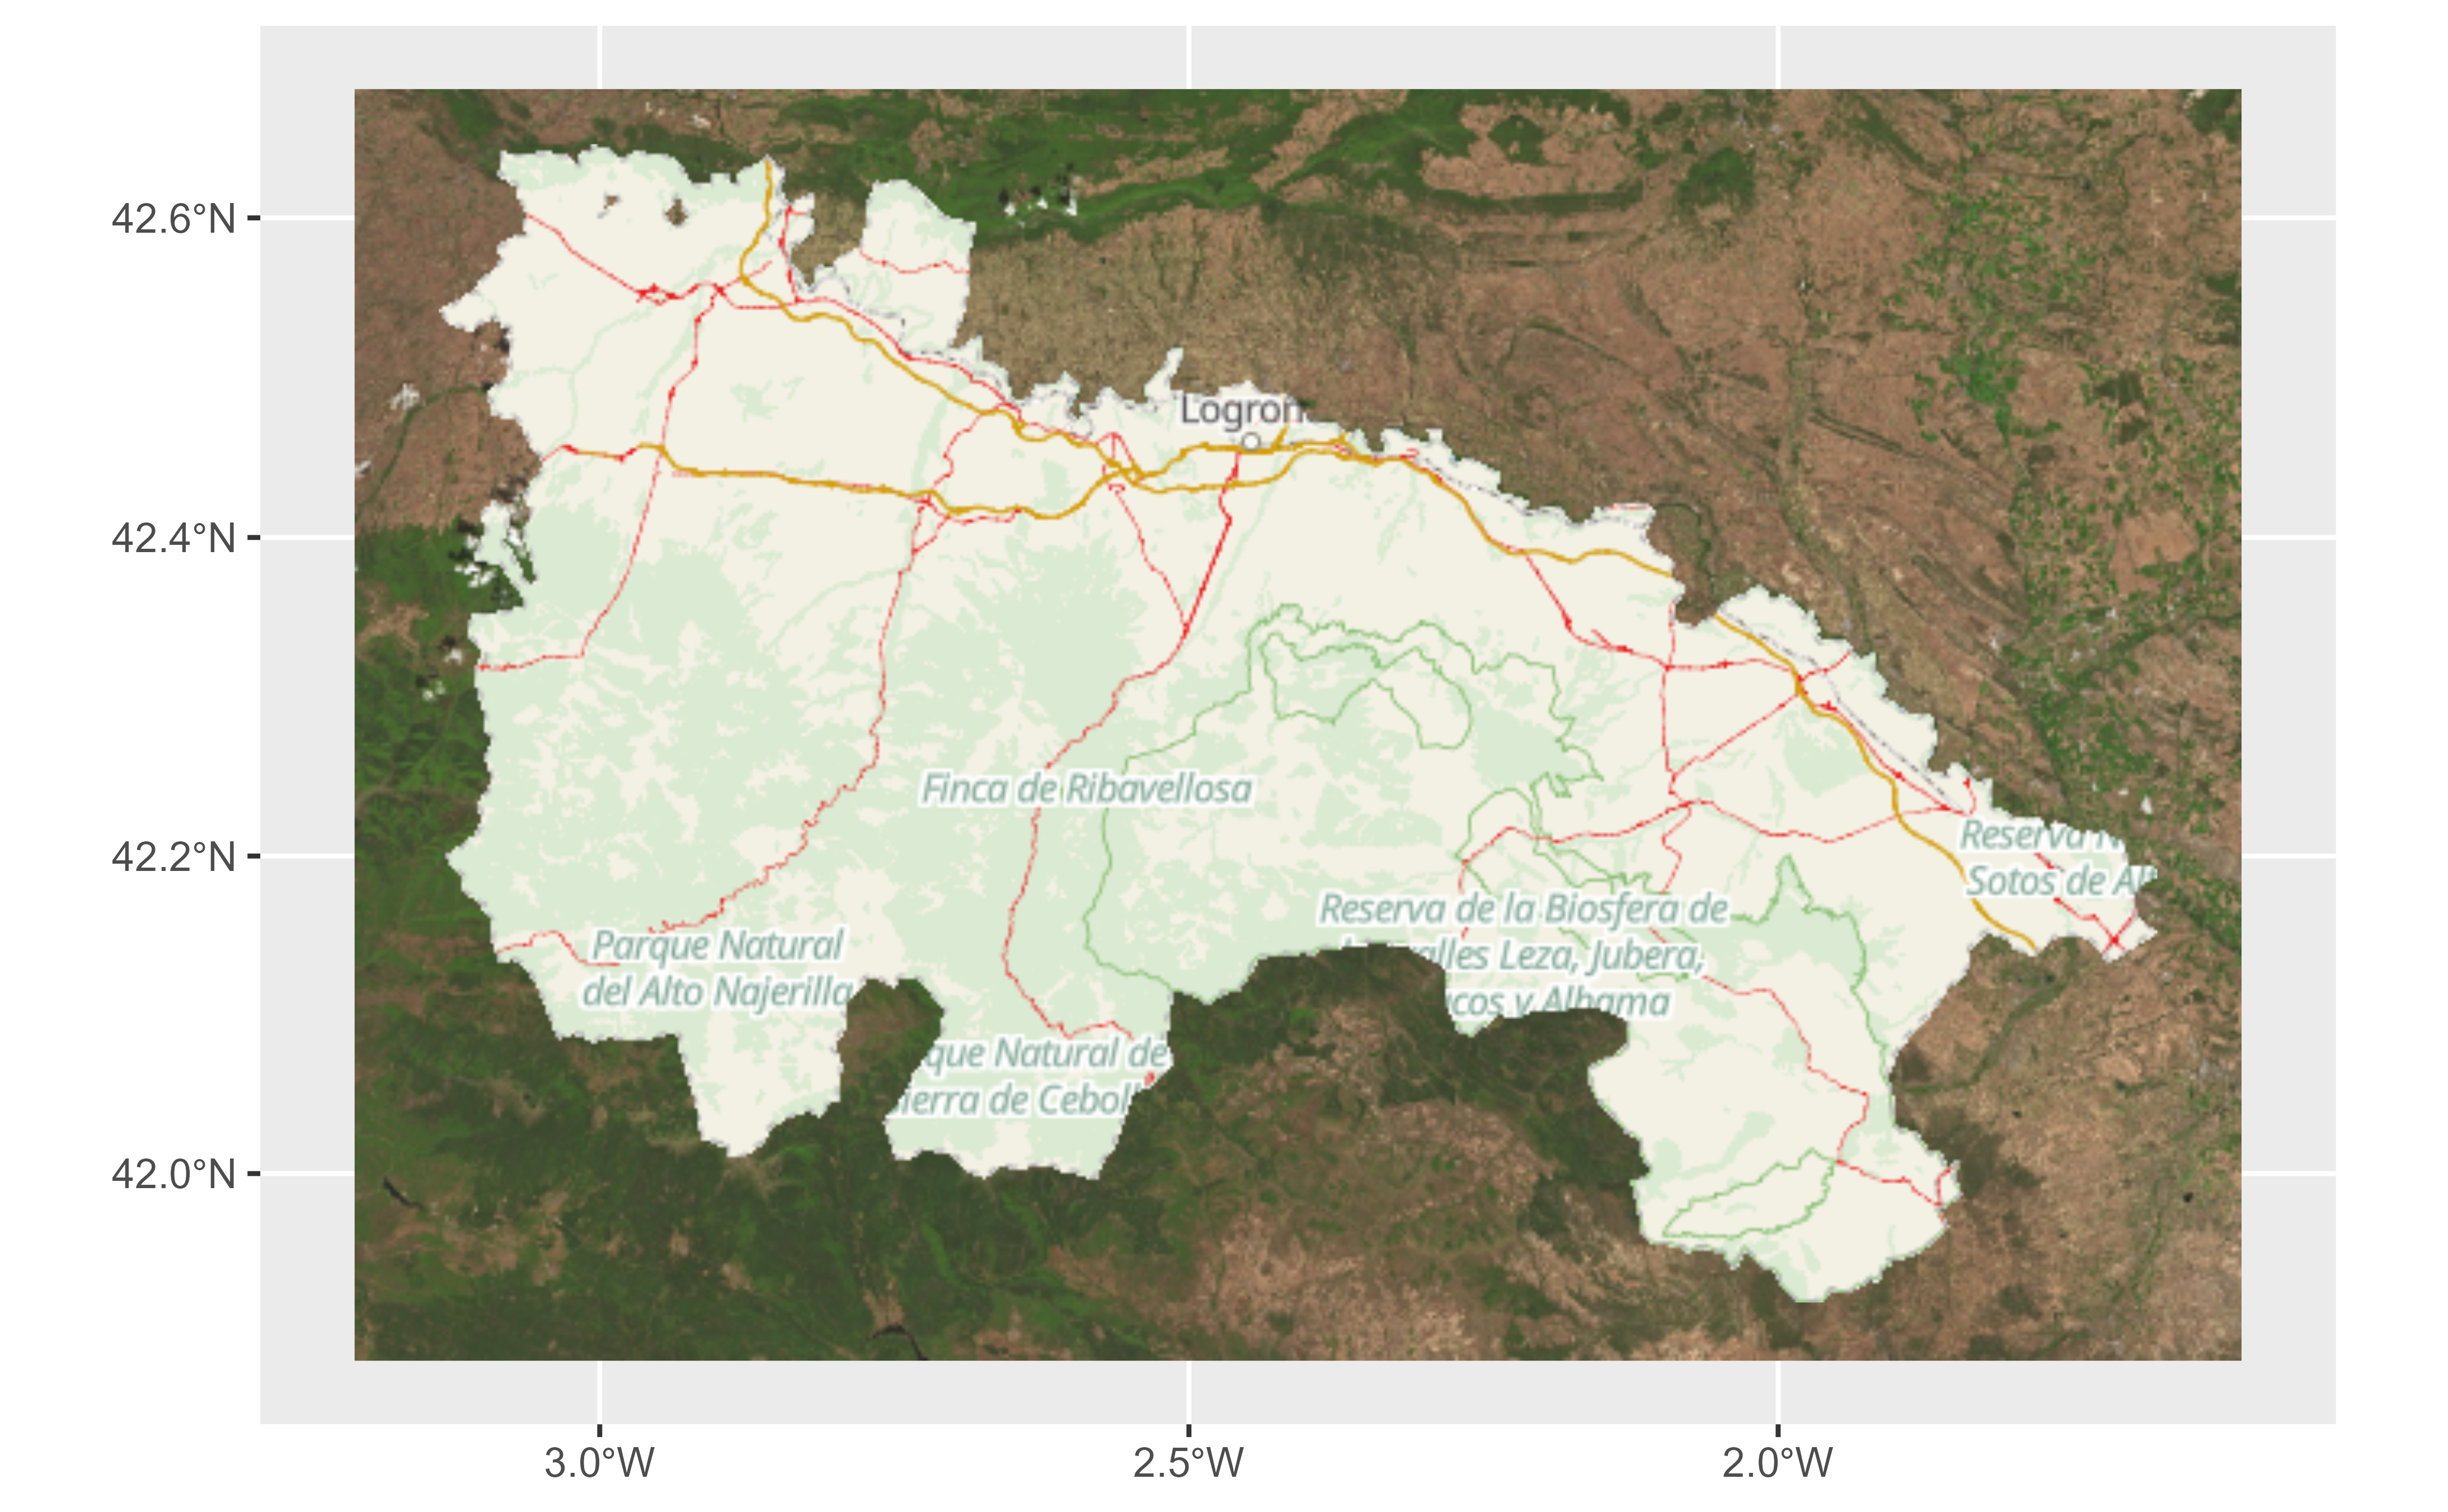
Custom providers
You can use esp_get_tiles() to get tiles of any other
provider, for example OpenStreetMap:
osm_spec <- list(
id = "OSM",
q = "https://tile.openstreetmap.org/{z}/{x}/{y}.png"
)
madrid_city <- esp_get_munic_siane(munic = "^Madrid$", epsg = 3857)
madrid_osm <- esp_get_tiles(madrid_city, type = osm_spec, zoommin = 1)
ggplot() +
geom_spatraster_rgb(data = madrid_osm) +
geom_sf(data = madrid_city, fill = NA)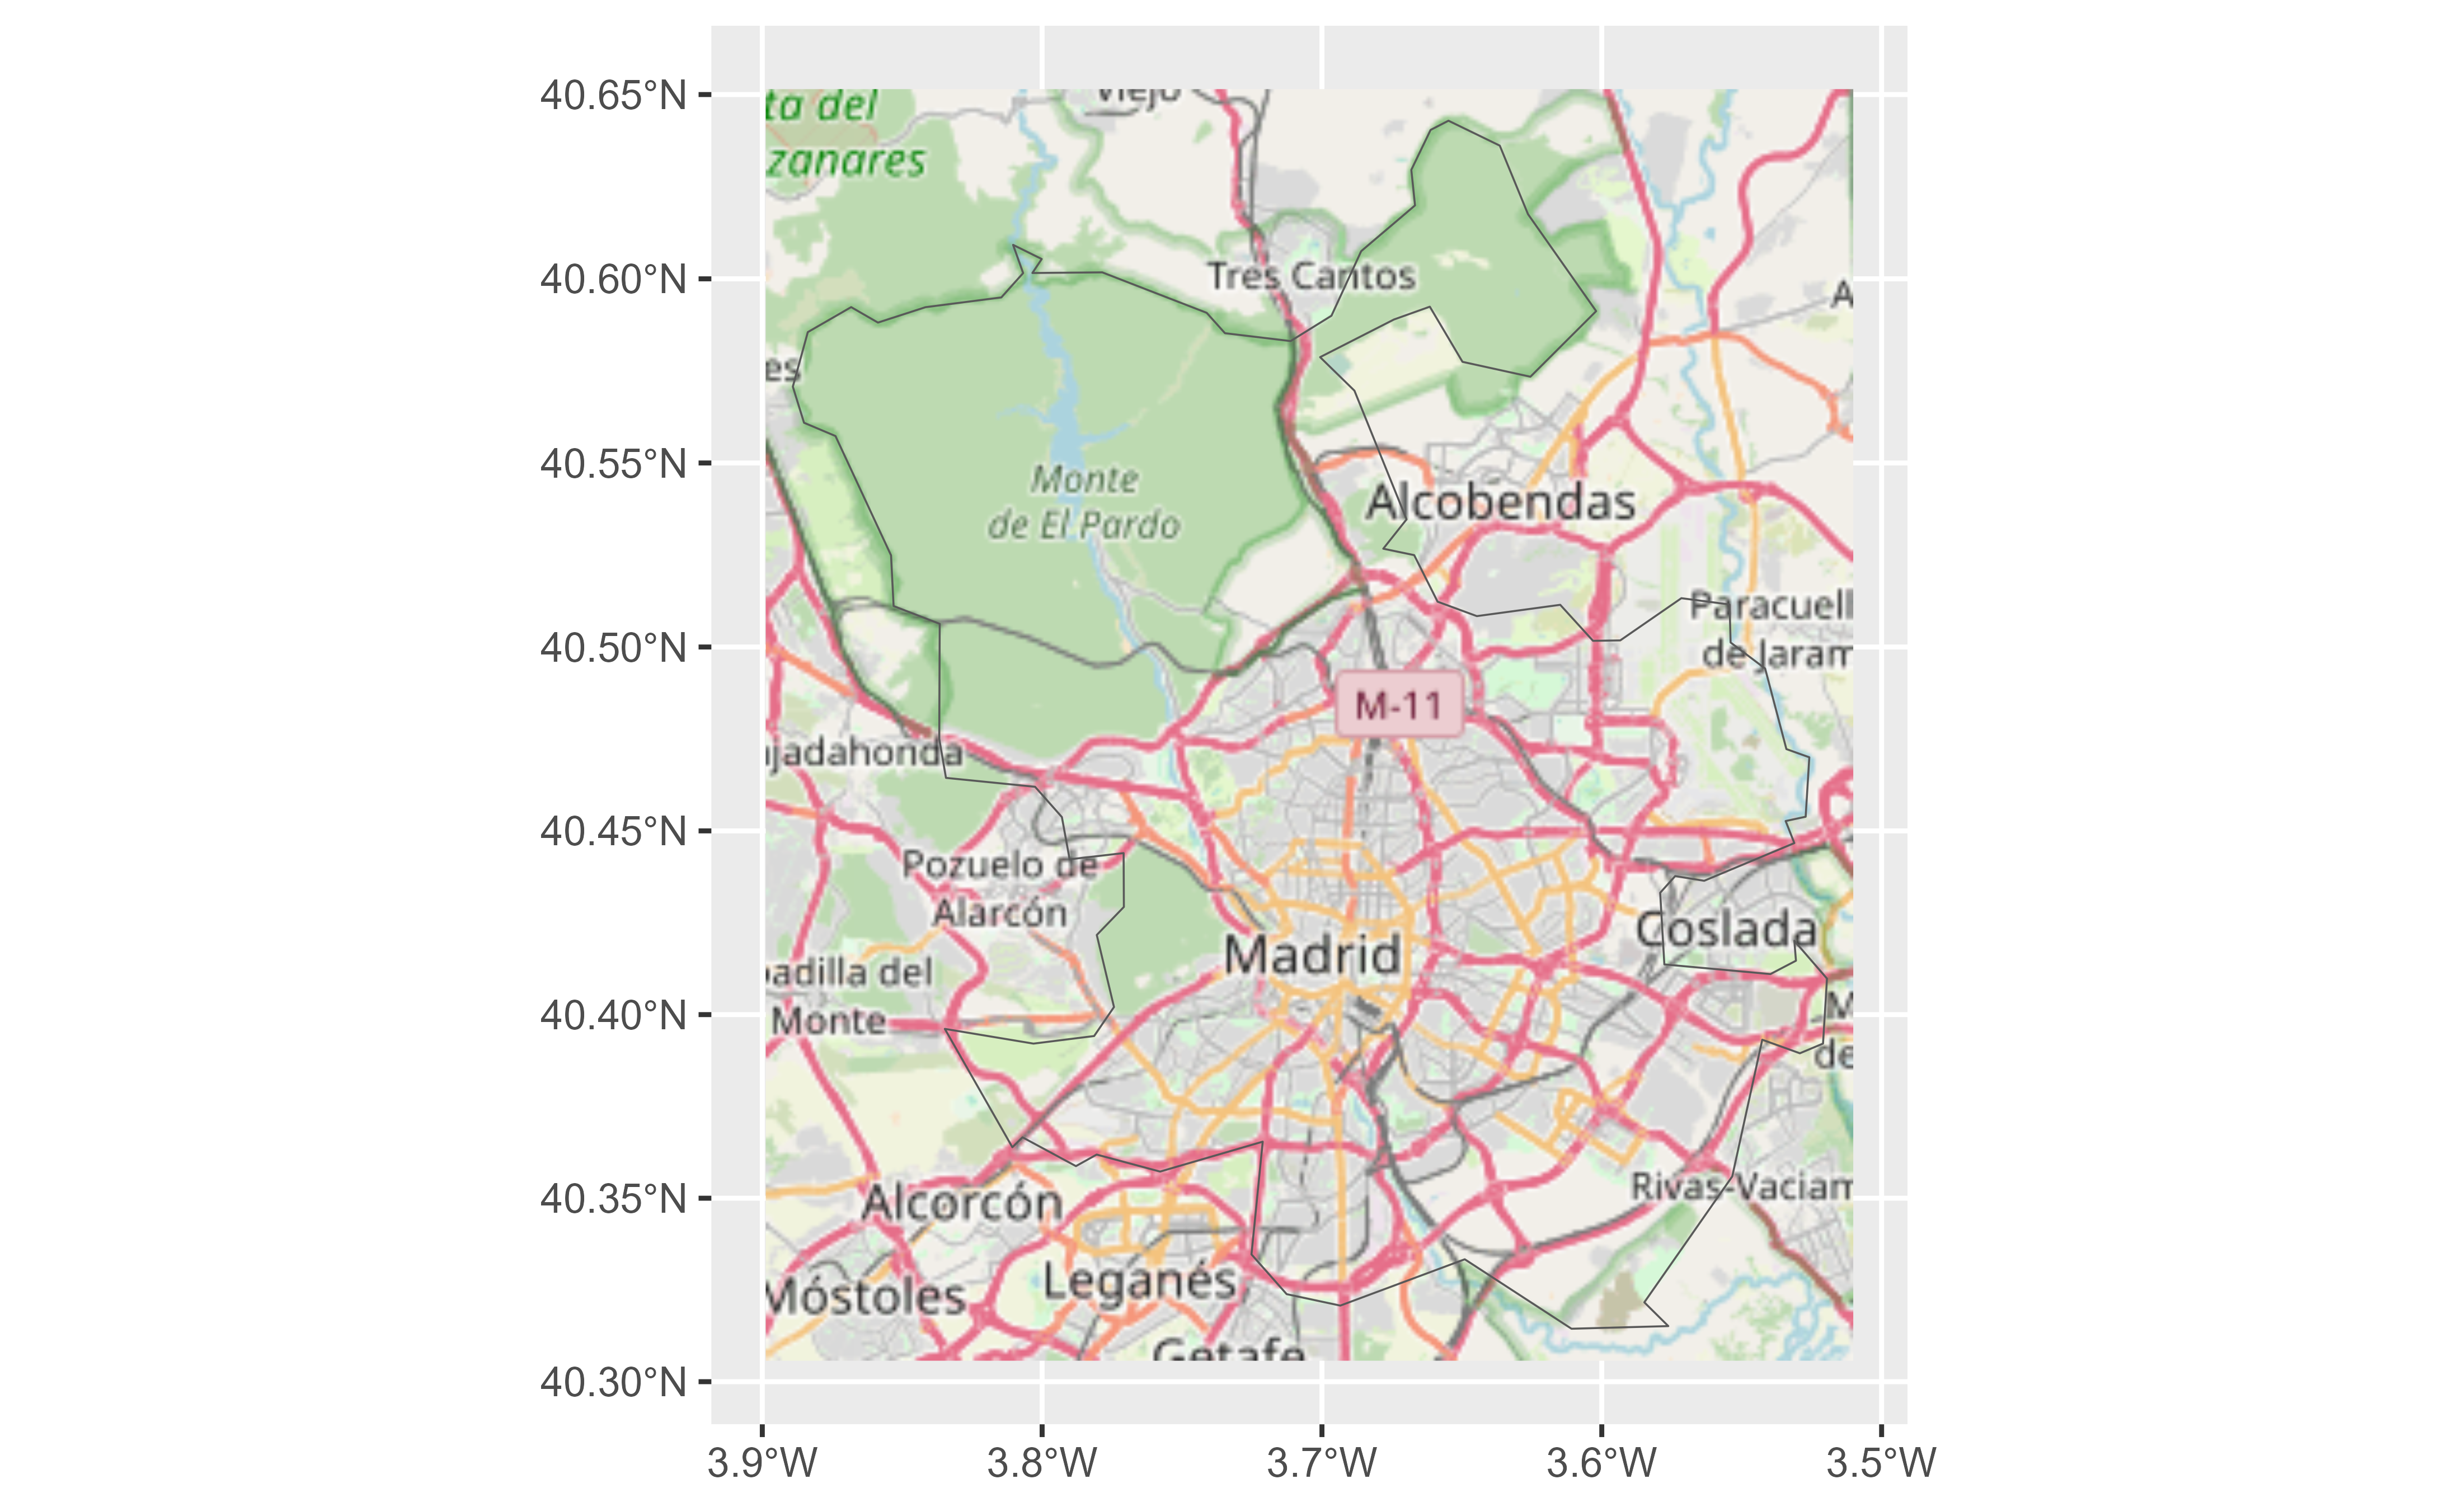
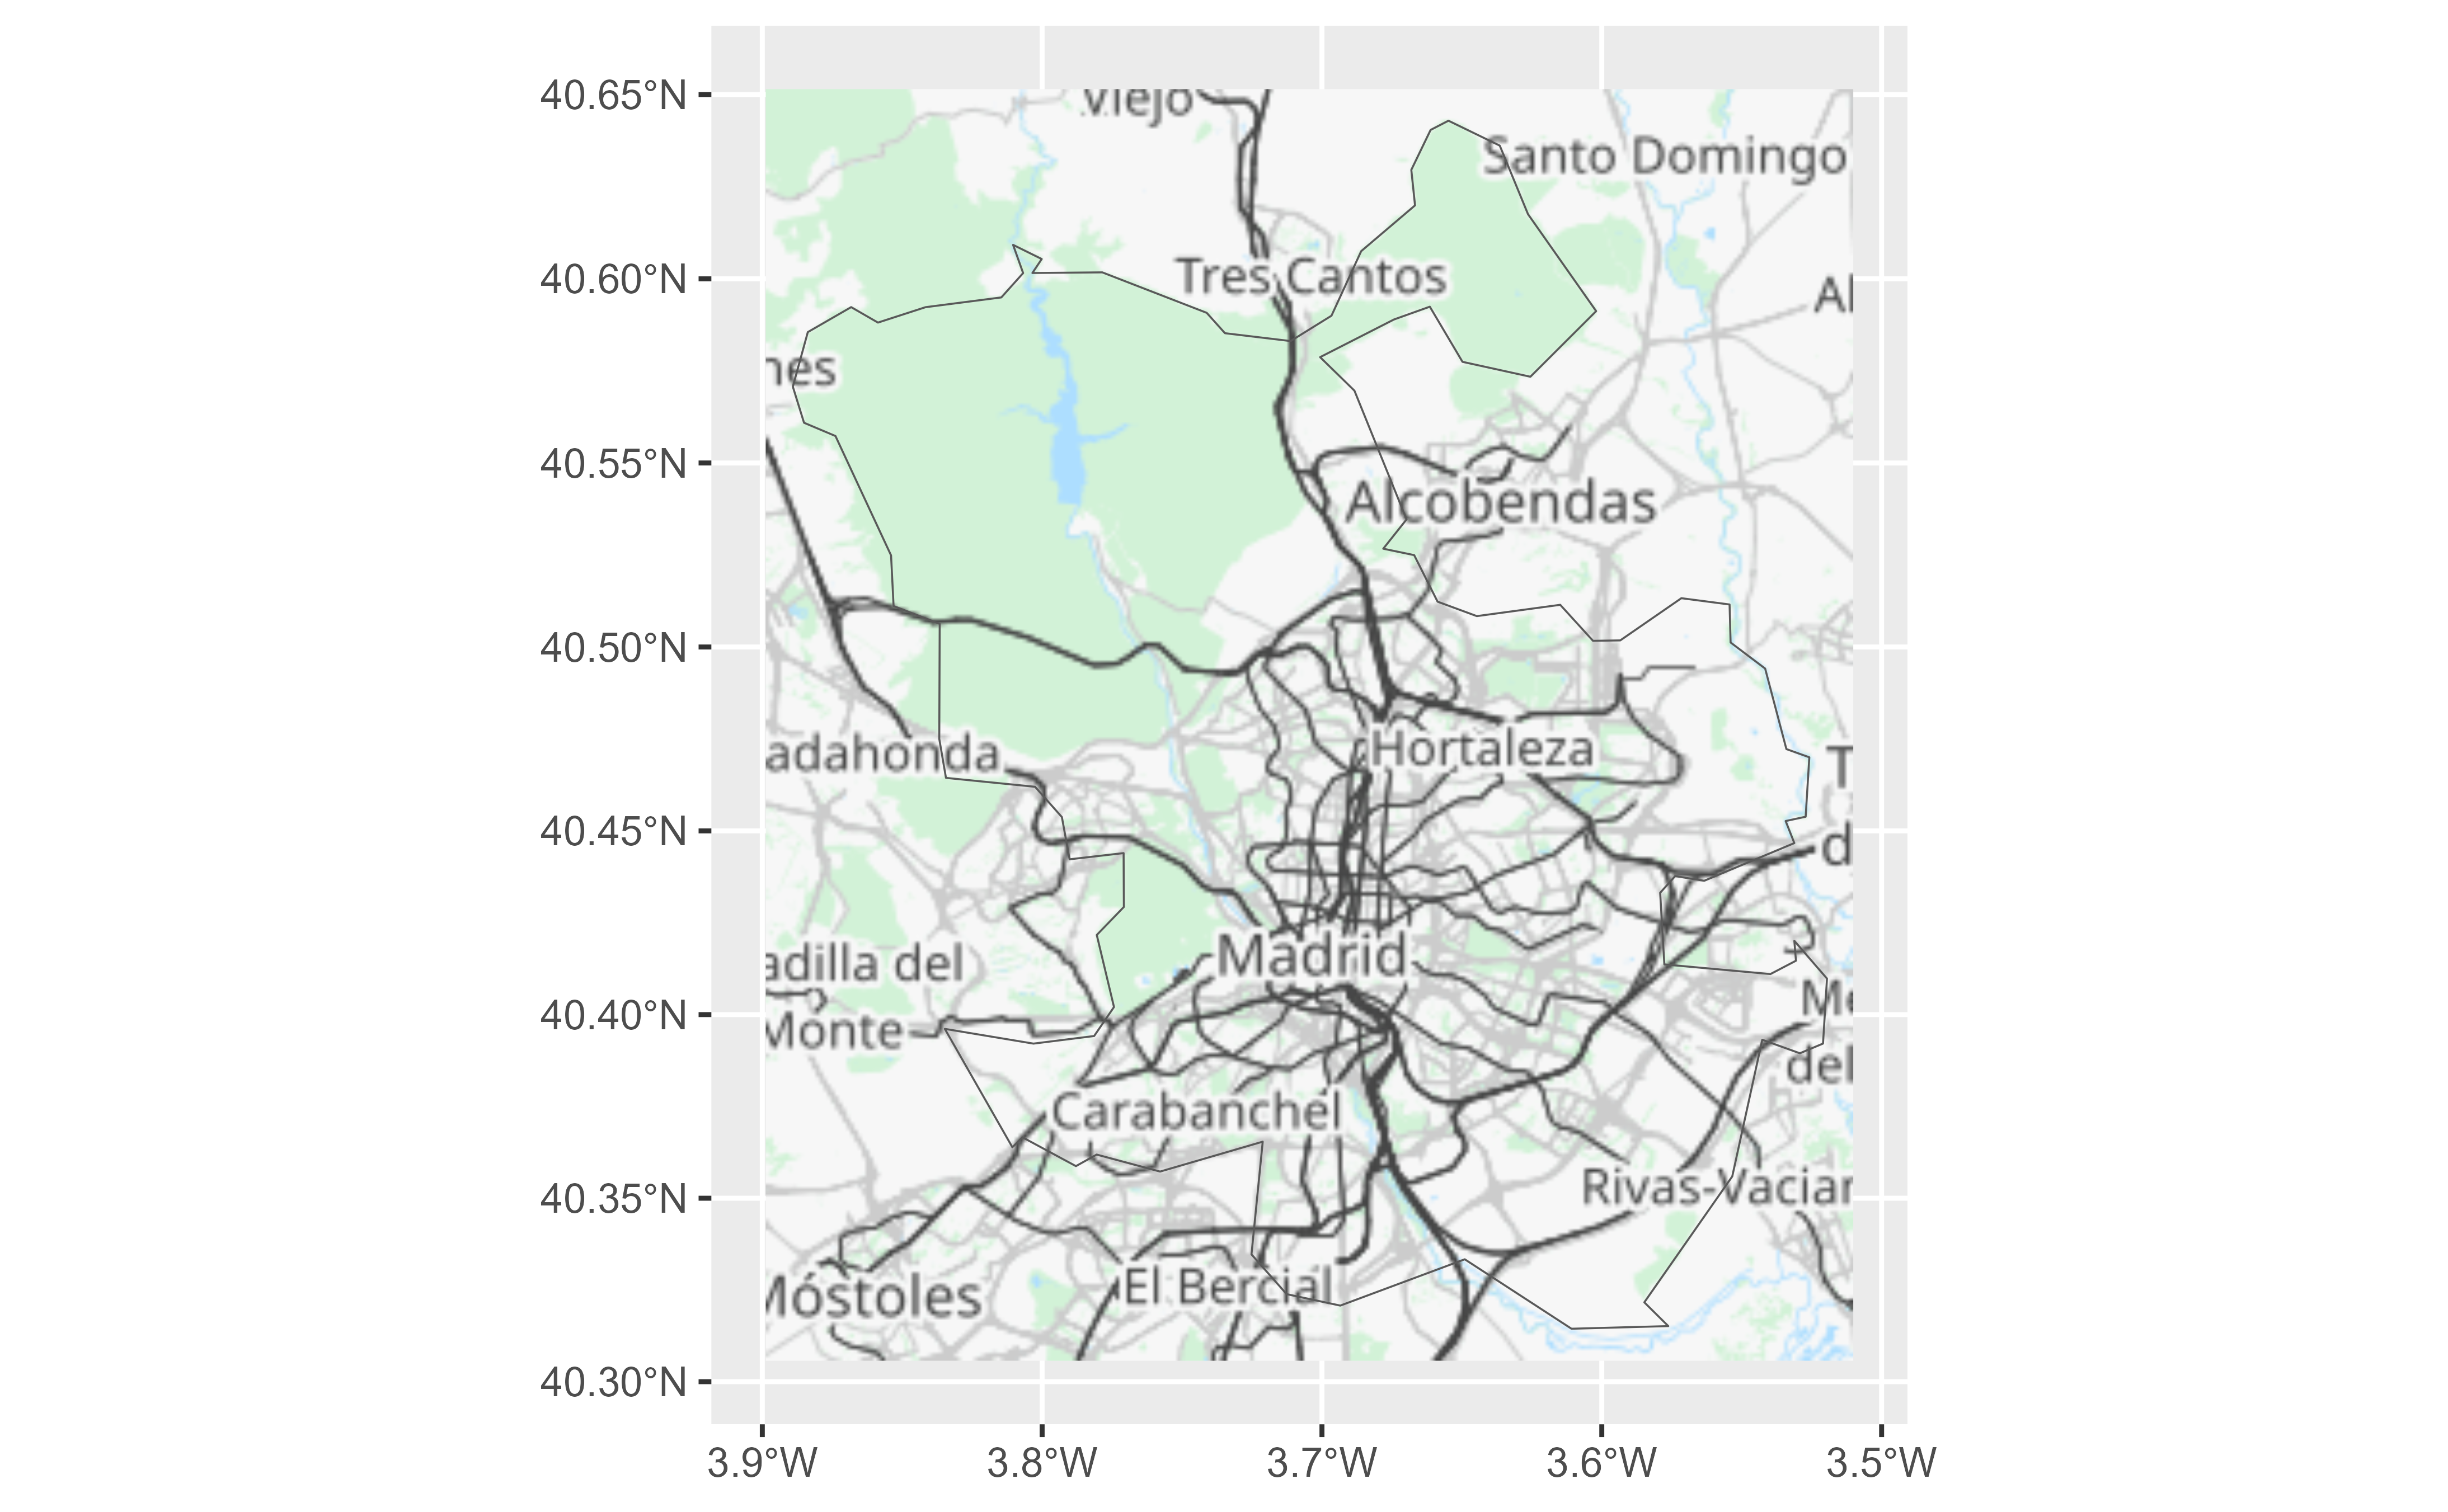
Another example using a provider that needs an API Key (ThunderForest):
# Skip if not API KEY
apikey <- Sys.getenv("THUNDERFOREST_API_KEY", "")
if (apikey != "") {
thunder_spec <- list(
id = "ThunderForest",
q = paste0(
"https://tile.thunderforest.com/transport/{z}/{x}/{y}.png?apikey=",
apikey
)
)
madrid_thunder <- esp_get_tiles(madrid_city, type = thunder_spec, zoommin = 1)
ggplot() +
geom_spatraster_rgb(data = madrid_thunder) +
geom_sf(data = madrid_city, fill = NA)
}
Dynamic maps with Leaflet
mapSpain provides a plugin for the Leaflet package. Below are some quick examples:
Earthquakes in Tenerife (last year)
library(leaflet)
tenerife_leaf <- esp_get_nuts(
region = "Tenerife", epsg = 4326,
moveCAN = FALSE
)
bbox <- as.double(round(st_bbox(tenerife_leaf) + c(-1, -1, 1, 1), 2))
# Start leaflet
m <- leaflet(tenerife_leaf,
elementId = "tenerife-earthquakes",
width = "100%", height = "60vh",
options = leafletOptions(minZoom = 9, maxZoom = 18)
)
# Add layers
m <- m |>
addProviderEspTiles("IDErioja.Relieve") |>
addPolygons(color = NA, fillColor = "red", group = "Polygon") |>
addProviderEspTiles("Geofisica.Terremotos365dias",
group = "Earthquakes"
)
# Add additional options
m |>
addLayersControl(
overlayGroups = c("Polygon", "Earthquakes"),
options = layersControlOptions(collapsed = FALSE)
) |>
setMaxBounds(bbox[1], bbox[2], bbox[3], bbox[4])Population density in Spain
A map showing the population density of Spain as of 2019:
library(leaflet)
library(dplyr)
munic <- esp_get_munic_siane(
year = "2025-01-01",
epsg = 4326,
moveCAN = FALSE,
rawcols = TRUE
) |>
# Get area in km2 from siane munic
# Already on the shapefile
mutate(area_km2 = st_area_sh * 10000)
# Get population
pop <- mapSpain::pobmun25 |>
select(-name)
# Paste
munic_pop <- munic |>
left_join(pop) |>
mutate(
dens = pob25 / area_km2,
dens_label = prettyNum(round(dens, 2),
big.mark = ".",
decimal.mark = ","
)
)
# Create leaflet
bins <- c(0, 10, 25, 100, 200, 500, 1000, 5000, 10000, Inf)
pal <- colorBin("inferno", domain = munic_pop$dens, bins = bins, reverse = TRUE)
labels <- sprintf(
"<strong>%s</strong><br/><em>%s</em><br/>%s pers. / km<sup>2</sup>",
munic_pop$rotulo,
munic_pop$ine.prov.name,
munic_pop$dens_label
) |> lapply(htmltools::HTML)
leaflet(elementId = "SpainDemo", width = "100%", height = "60vh") |>
setView(lng = -3.684444, lat = 40.308611, zoom = 5) |>
addProviderEspTiles("IDErioja") |>
addPolygons(
data = munic_pop,
fillColor = ~ pal(dens),
fillOpacity = 0.6,
color = "#44444",
weight = 0.5,
smoothFactor = .1,
opacity = 1,
highlightOptions = highlightOptions(
color = "white",
weight = 1,
bringToFront = TRUE
),
popup = labels
) |>
addLegend(
pal = pal, values = bins, opacity = 0.7,
title = paste0(
"<small>Pop. Density km<sup>2</sup></small><br><small>",
"(2025)</small>"
),
position = "bottomright"
)Available providers
The esp_tiles_providers list contains metadata for the
tile providers available to the functions above. It includes all
arguments required to reproduce the API request. Below is the static URL
for each provider:
Session info
Details
#> ─ Session info ───────────────────────────────────────────────────────────────
#> setting value
#> version R version 4.5.2 (2025-10-31 ucrt)
#> os Windows Server 2022 x64 (build 26100)
#> system x86_64, mingw32
#> ui RTerm
#> language en
#> collate English_United States.utf8
#> ctype English_United States.utf8
#> tz UTC
#> date 2026-01-23
#> pandoc 3.1.11 @ C:/HOSTED~1/windows/pandoc/31F387~1.11/x64/PANDOC~1.11/ (via rmarkdown)
#> quarto NA
#>
#> ─ Packages ───────────────────────────────────────────────────────────────────
#> package * version date (UTC) lib source
#> bslib 0.9.0 2025-01-30 [1] RSPM
#> cachem 1.1.0 2024-05-16 [1] RSPM
#> class 7.3-23 2025-01-01 [3] CRAN (R 4.5.2)
#> classInt 0.4-11 2025-01-08 [1] RSPM
#> cli 3.6.5 2025-04-23 [1] RSPM
#> codetools 0.2-20 2024-03-31 [3] CRAN (R 4.5.2)
#> countrycode 1.6.1 2025-03-31 [1] RSPM
#> crosstalk 1.2.2 2025-08-26 [1] RSPM
#> curl 7.0.0 2025-08-19 [1] RSPM
#> DBI 1.2.3 2024-06-02 [1] RSPM
#> desc 1.4.3 2023-12-10 [1] RSPM
#> digest 0.6.39 2025-11-19 [1] RSPM
#> dplyr * 1.1.4 2023-11-17 [1] RSPM
#> e1071 1.7-17 2025-12-18 [1] RSPM
#> evaluate 1.0.5 2025-08-27 [1] RSPM
#> farver 2.1.2 2024-05-13 [1] RSPM
#> fastmap 1.2.0 2024-05-15 [1] RSPM
#> fs 1.6.6 2025-04-12 [1] RSPM
#> generics 0.1.4 2025-05-09 [1] RSPM
#> ggplot2 * 4.0.1 2025-11-14 [1] RSPM
#> giscoR 1.0.0 2025-12-10 [1] RSPM
#> glue 1.8.0 2024-09-30 [1] RSPM
#> gtable 0.3.6 2024-10-25 [1] RSPM
#> htmltools 0.5.9 2025-12-04 [1] RSPM
#> htmlwidgets 1.6.4 2023-12-06 [1] RSPM
#> httr2 1.2.2 2025-12-08 [1] RSPM
#> jquerylib 0.1.4 2021-04-26 [1] RSPM
#> jsonlite 2.0.0 2025-03-27 [1] RSPM
#> KernSmooth 2.23-26 2025-01-01 [3] CRAN (R 4.5.2)
#> knitr 1.51 2025-12-20 [1] RSPM
#> leaflet * 2.2.3 2025-09-04 [1] RSPM
#> lifecycle 1.0.5 2026-01-08 [1] RSPM
#> magrittr 2.0.4 2025-09-12 [1] RSPM
#> mapSpain * 1.0.0 2026-01-23 [1] local
#> otel 0.2.0 2025-08-29 [1] RSPM
#> pillar 1.11.1 2025-09-17 [1] RSPM
#> pkgconfig 2.0.3 2019-09-22 [1] RSPM
#> pkgdown 2.2.0 2025-11-06 [1] any (@2.2.0)
#> proxy 0.4-29 2025-12-29 [1] RSPM
#> purrr 1.2.1 2026-01-09 [1] RSPM
#> R.cache 0.17.0 2025-05-02 [1] RSPM
#> R.methodsS3 1.8.2 2022-06-13 [1] RSPM
#> R.oo 1.27.1 2025-05-02 [1] RSPM
#> R.utils 2.13.0 2025-02-24 [1] RSPM
#> R6 2.6.1 2025-02-15 [1] RSPM
#> ragg 1.5.0 2025-09-02 [1] RSPM
#> rappdirs 0.3.4 2026-01-17 [1] RSPM
#> RColorBrewer 1.1-3 2022-04-03 [1] RSPM
#> Rcpp 1.1.1 2026-01-10 [1] RSPM
#> reactable * 0.4.5 2025-12-01 [1] RSPM
#> reactR 0.6.1 2024-09-14 [1] RSPM
#> rlang 1.1.7 2026-01-09 [1] RSPM
#> rmarkdown 2.30 2025-09-28 [1] RSPM
#> s2 1.1.9 2025-05-23 [1] RSPM
#> S7 0.2.1 2025-11-14 [1] RSPM
#> sass 0.4.10 2025-04-11 [1] RSPM
#> scales 1.4.0 2025-04-24 [1] RSPM
#> sessioninfo * 1.2.3 2025-02-05 [1] any (@1.2.3)
#> sf * 1.0-24 2026-01-13 [1] RSPM
#> styler 1.11.0 2025-10-13 [1] RSPM
#> systemfonts 1.3.1 2025-10-01 [1] RSPM
#> terra 1.8-93 2026-01-12 [1] RSPM
#> textshaping 1.0.4 2025-10-10 [1] RSPM
#> tibble 3.3.1 2026-01-11 [1] RSPM
#> tidyr 1.3.2 2025-12-19 [1] RSPM
#> tidyselect 1.2.1 2024-03-11 [1] RSPM
#> tidyterra * 0.7.2 2025-04-14 [1] RSPM
#> units 1.0-0 2025-10-09 [1] RSPM
#> vctrs 0.7.0 2026-01-16 [1] RSPM
#> viridisLite 0.4.2 2023-05-02 [1] RSPM
#> withr 3.0.2 2024-10-28 [1] RSPM
#> wk 0.9.5 2025-12-18 [1] RSPM
#> xfun 0.56 2026-01-18 [1] RSPM
#> yaml 2.3.12 2025-12-10 [1] RSPM
#>
#> [1] D:/a/_temp/Library
#> [2] C:/R/site-library
#> [3] C:/R/library
#> * ── Packages attached to the search path.
#>
#> ──────────────────────────────────────────────────────────────────────────────