The GISCO statistical unit dataset represents NUTS (Nomenclature of Territorial Units for Statistics) and statistical regions using multipart polygon, polyline and point topology. The NUTS geographical information is completed by attribute tables and a set of cartographic help lines to better visualize multipart polygonal regions.
NUTS is a hierarchical system divided into three levels:
NUTS 1: major socioeconomic regions.
NUTS 2: basic regions for the application of regional policies.
NUTS 3: small regions for specific diagnoses.
There is also a NUTS 0 level, which usually corresponds to the national boundaries.
Source
https://gisco-services.ec.europa.eu/distribution/v2/.
Copyright: https://ec.europa.eu/eurostat/web/gisco/geodata/administrative-units.
Arguments
- year
Year character string or number. Release year of the file. See
giscoR::gisco_get_nuts()for valid values.- epsg
Character string or number. Projection of the map: 4-digit EPSG code. One of:
"4258": ETRS89."4326": WGS84."3035": ETRS89 / ETRS-LAEA."3857": Pseudo-Mercator.
- cache
Logical. Whether to cache downloaded files. Defaults to
TRUE. See Caching.- update_cache
Logical. If
TRUE, refreshes the cached file and forces a new download. Defaults toFALSE.- cache_dir
Character string. A path to a cache directory. See Caching.
- verbose
A logical value. If
TRUEdisplays informational messages.- resolution
A character string or numeric value with the geospatial data resolution. One of:
"60": 1:60 million."20": 1:20 million."10": 1:10 million."03": 1:3 million."01": 1:1 million.
- spatialtype
Character string. Type of geometry to be returned. Options available are:
"RG": regions, returned as aMULTIPOLYGON/POLYGONobject."LB": labels, returned as aPOINTobject.
- region
Optional. A vector of region names, NUTS or ISO codes (see
esp_dict_region_code()).- nuts_level
A character string with the NUTS level. One of
0,1,2,3orallfor all levels.- moveCAN
A logical
TRUE/FALSEor a vector of coordinatesc(lat, lon). It places the Canary Islands close to Spain's mainland. Initial position can be adjusted using the vector of coordinates. See Displacing the Canary Islands inesp_move_can().- ext
Character. Extension of the file (default
"gpkg"). SeegiscoR::gisco_get_nuts().
Value
A sf object.
Details
The NUTS nomenclature is a hierarchical classification of statistical regions and subdivides the EU economic territory into regions of three different levels (NUTS 1, 2 and 3, moving respectively from larger to smaller territorial units). NUTS 1 is the most aggregated level. An additional country level (NUTS 0) is also available for countries where the nation at statistical level does not coincide with the administrative boundaries.
The NUTS classification has been officially established through Commission Delegated Regulation 2019/1755. An unofficial NUTS-like classification has been defined for the EFTA countries, candidate countries and potential candidates based on a bilateral agreement between Eurostat and the respective statistical agencies.
Note
Please check the download and usage provisions on
giscoR::gisco_attributions().
Caching
Functions that download data store files in cache_dir. When cache_dir
is NULL, they use the active package cache, which defaults to a temporary
directory. Set update_cache = TRUE to replace an existing cached file.
See Caching strategies in esp_set_cache_dir() to configure a
persistent cache.
See also
giscoR::gisco_get_nuts()retrieves NUTS data from GISCO.esp_dict_region_code()converts Spanish subdivision identifiers.
NUTS boundary datasets:
esp_get_spain()
GISCO boundary data:
esp_get_ccaa(),
esp_get_munic(),
esp_get_prov(),
esp_get_spain()
Examples
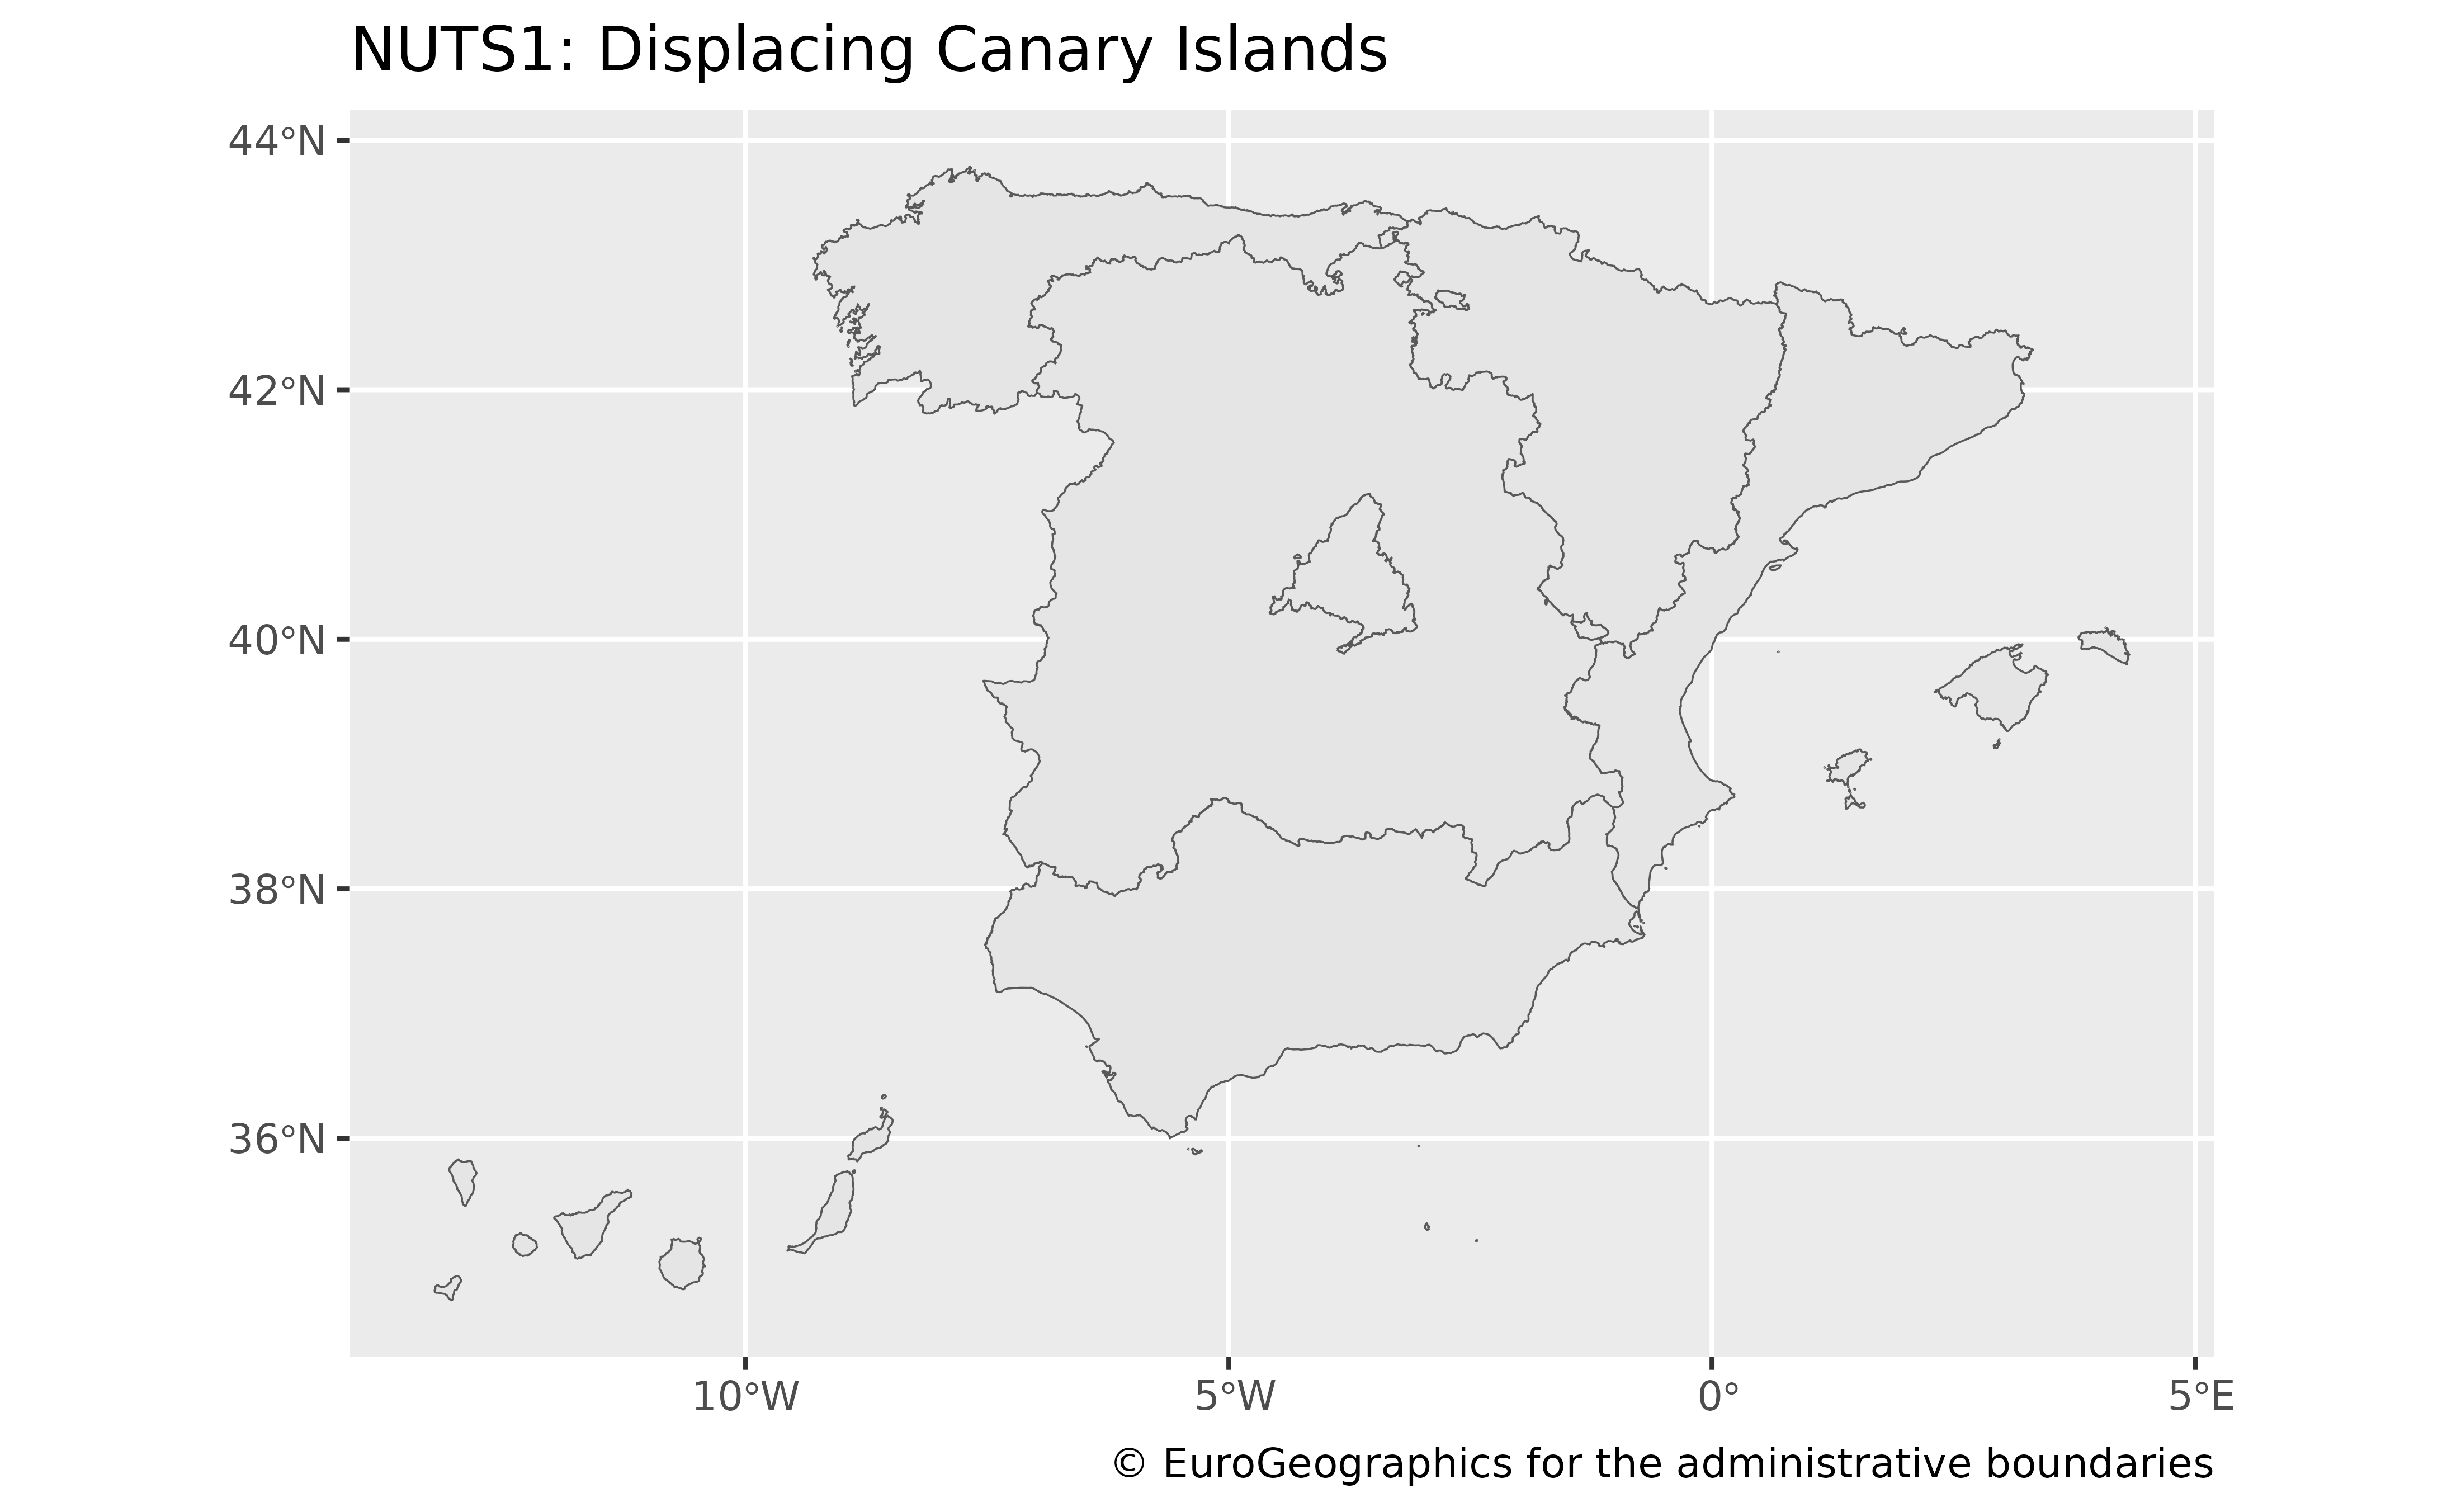
nuts1 <- esp_get_nuts(nuts_level = 1, moveCAN = TRUE)
library(ggplot2)
ggplot(nuts1) +
geom_sf() +
labs(
title = "NUTS 1: Displacing Canary Islands",
caption = giscoR::gisco_attributions()
)
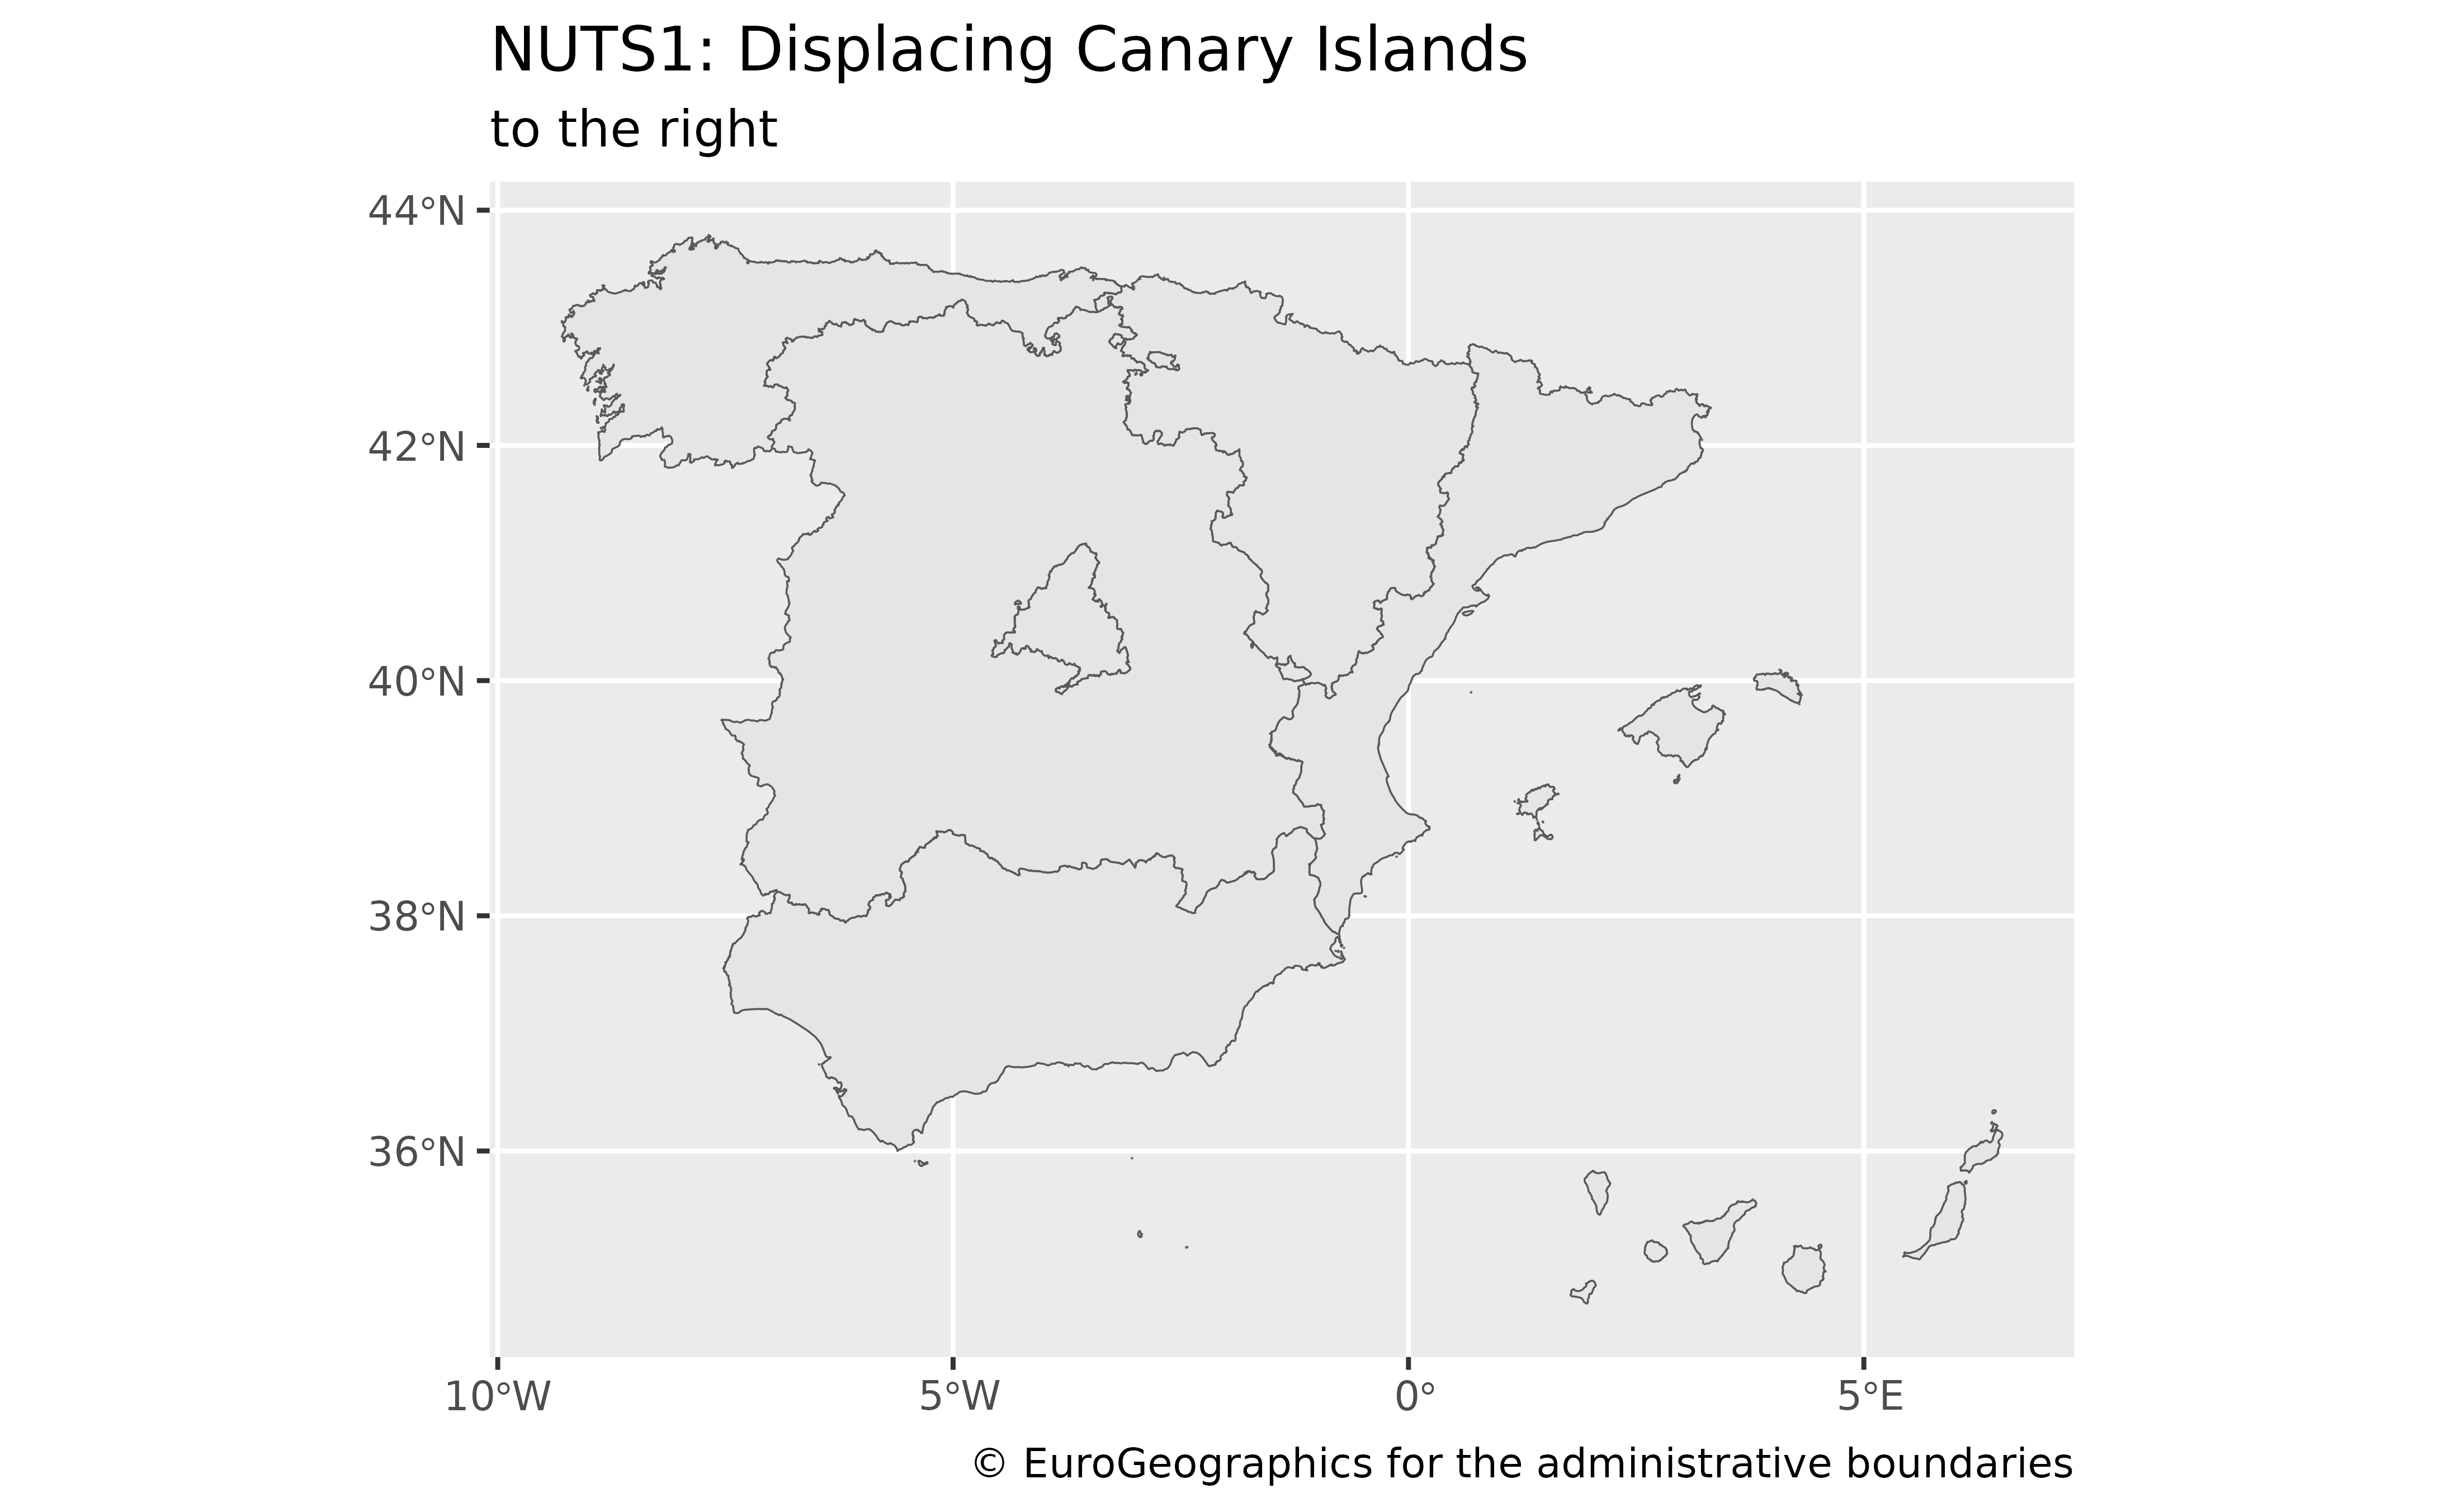
 nuts1_alt <- esp_get_nuts(nuts_level = 1, moveCAN = c(15, 0))
ggplot(nuts1_alt) +
geom_sf() +
labs(
title = "NUTS 1: Displacing Canary Islands",
subtitle = "to the right",
caption = giscoR::gisco_attributions()
)
nuts1_alt <- esp_get_nuts(nuts_level = 1, moveCAN = c(15, 0))
ggplot(nuts1_alt) +
geom_sf() +
labs(
title = "NUTS 1: Displacing Canary Islands",
subtitle = "to the right",
caption = giscoR::gisco_attributions()
)
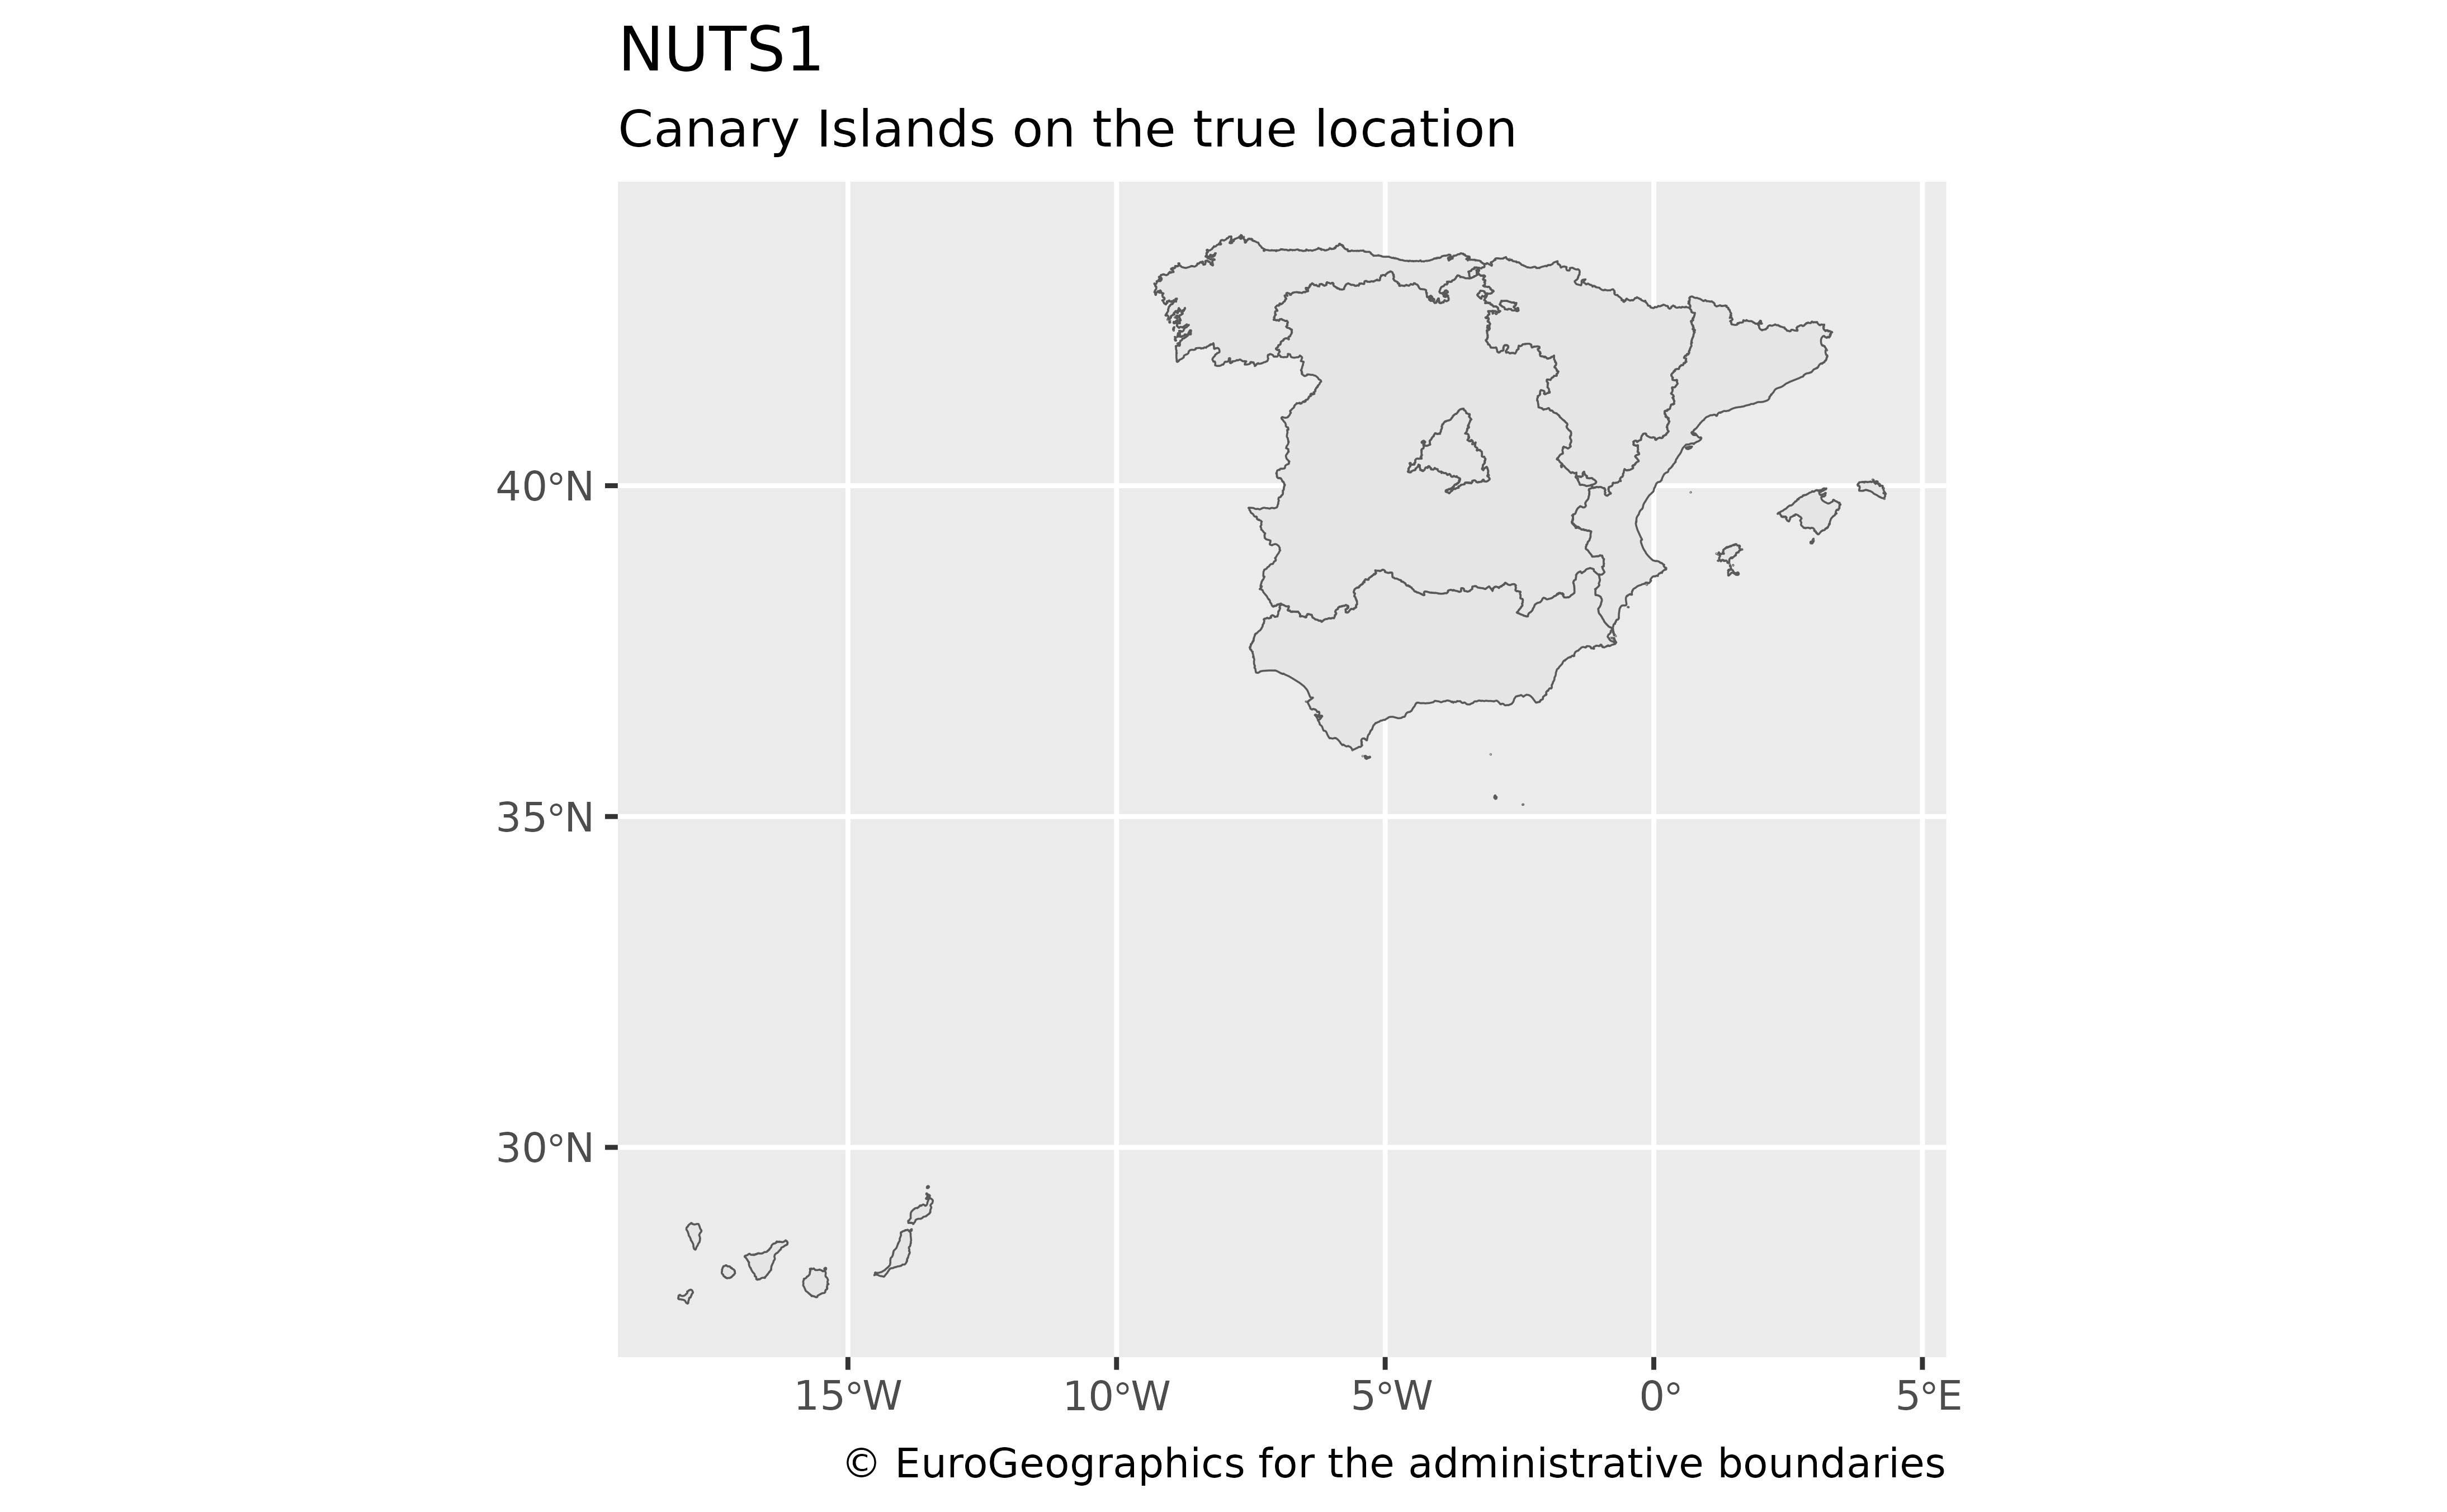
 nuts1_orig <- esp_get_nuts(nuts_level = 1, moveCAN = FALSE)
ggplot(nuts1_orig) +
geom_sf() +
labs(
title = "NUTS 1",
subtitle = "Canary Islands in their true location",
caption = giscoR::gisco_attributions()
)
nuts1_orig <- esp_get_nuts(nuts_level = 1, moveCAN = FALSE)
ggplot(nuts1_orig) +
geom_sf() +
labs(
title = "NUTS 1",
subtitle = "Canary Islands in their true location",
caption = giscoR::gisco_attributions()
)
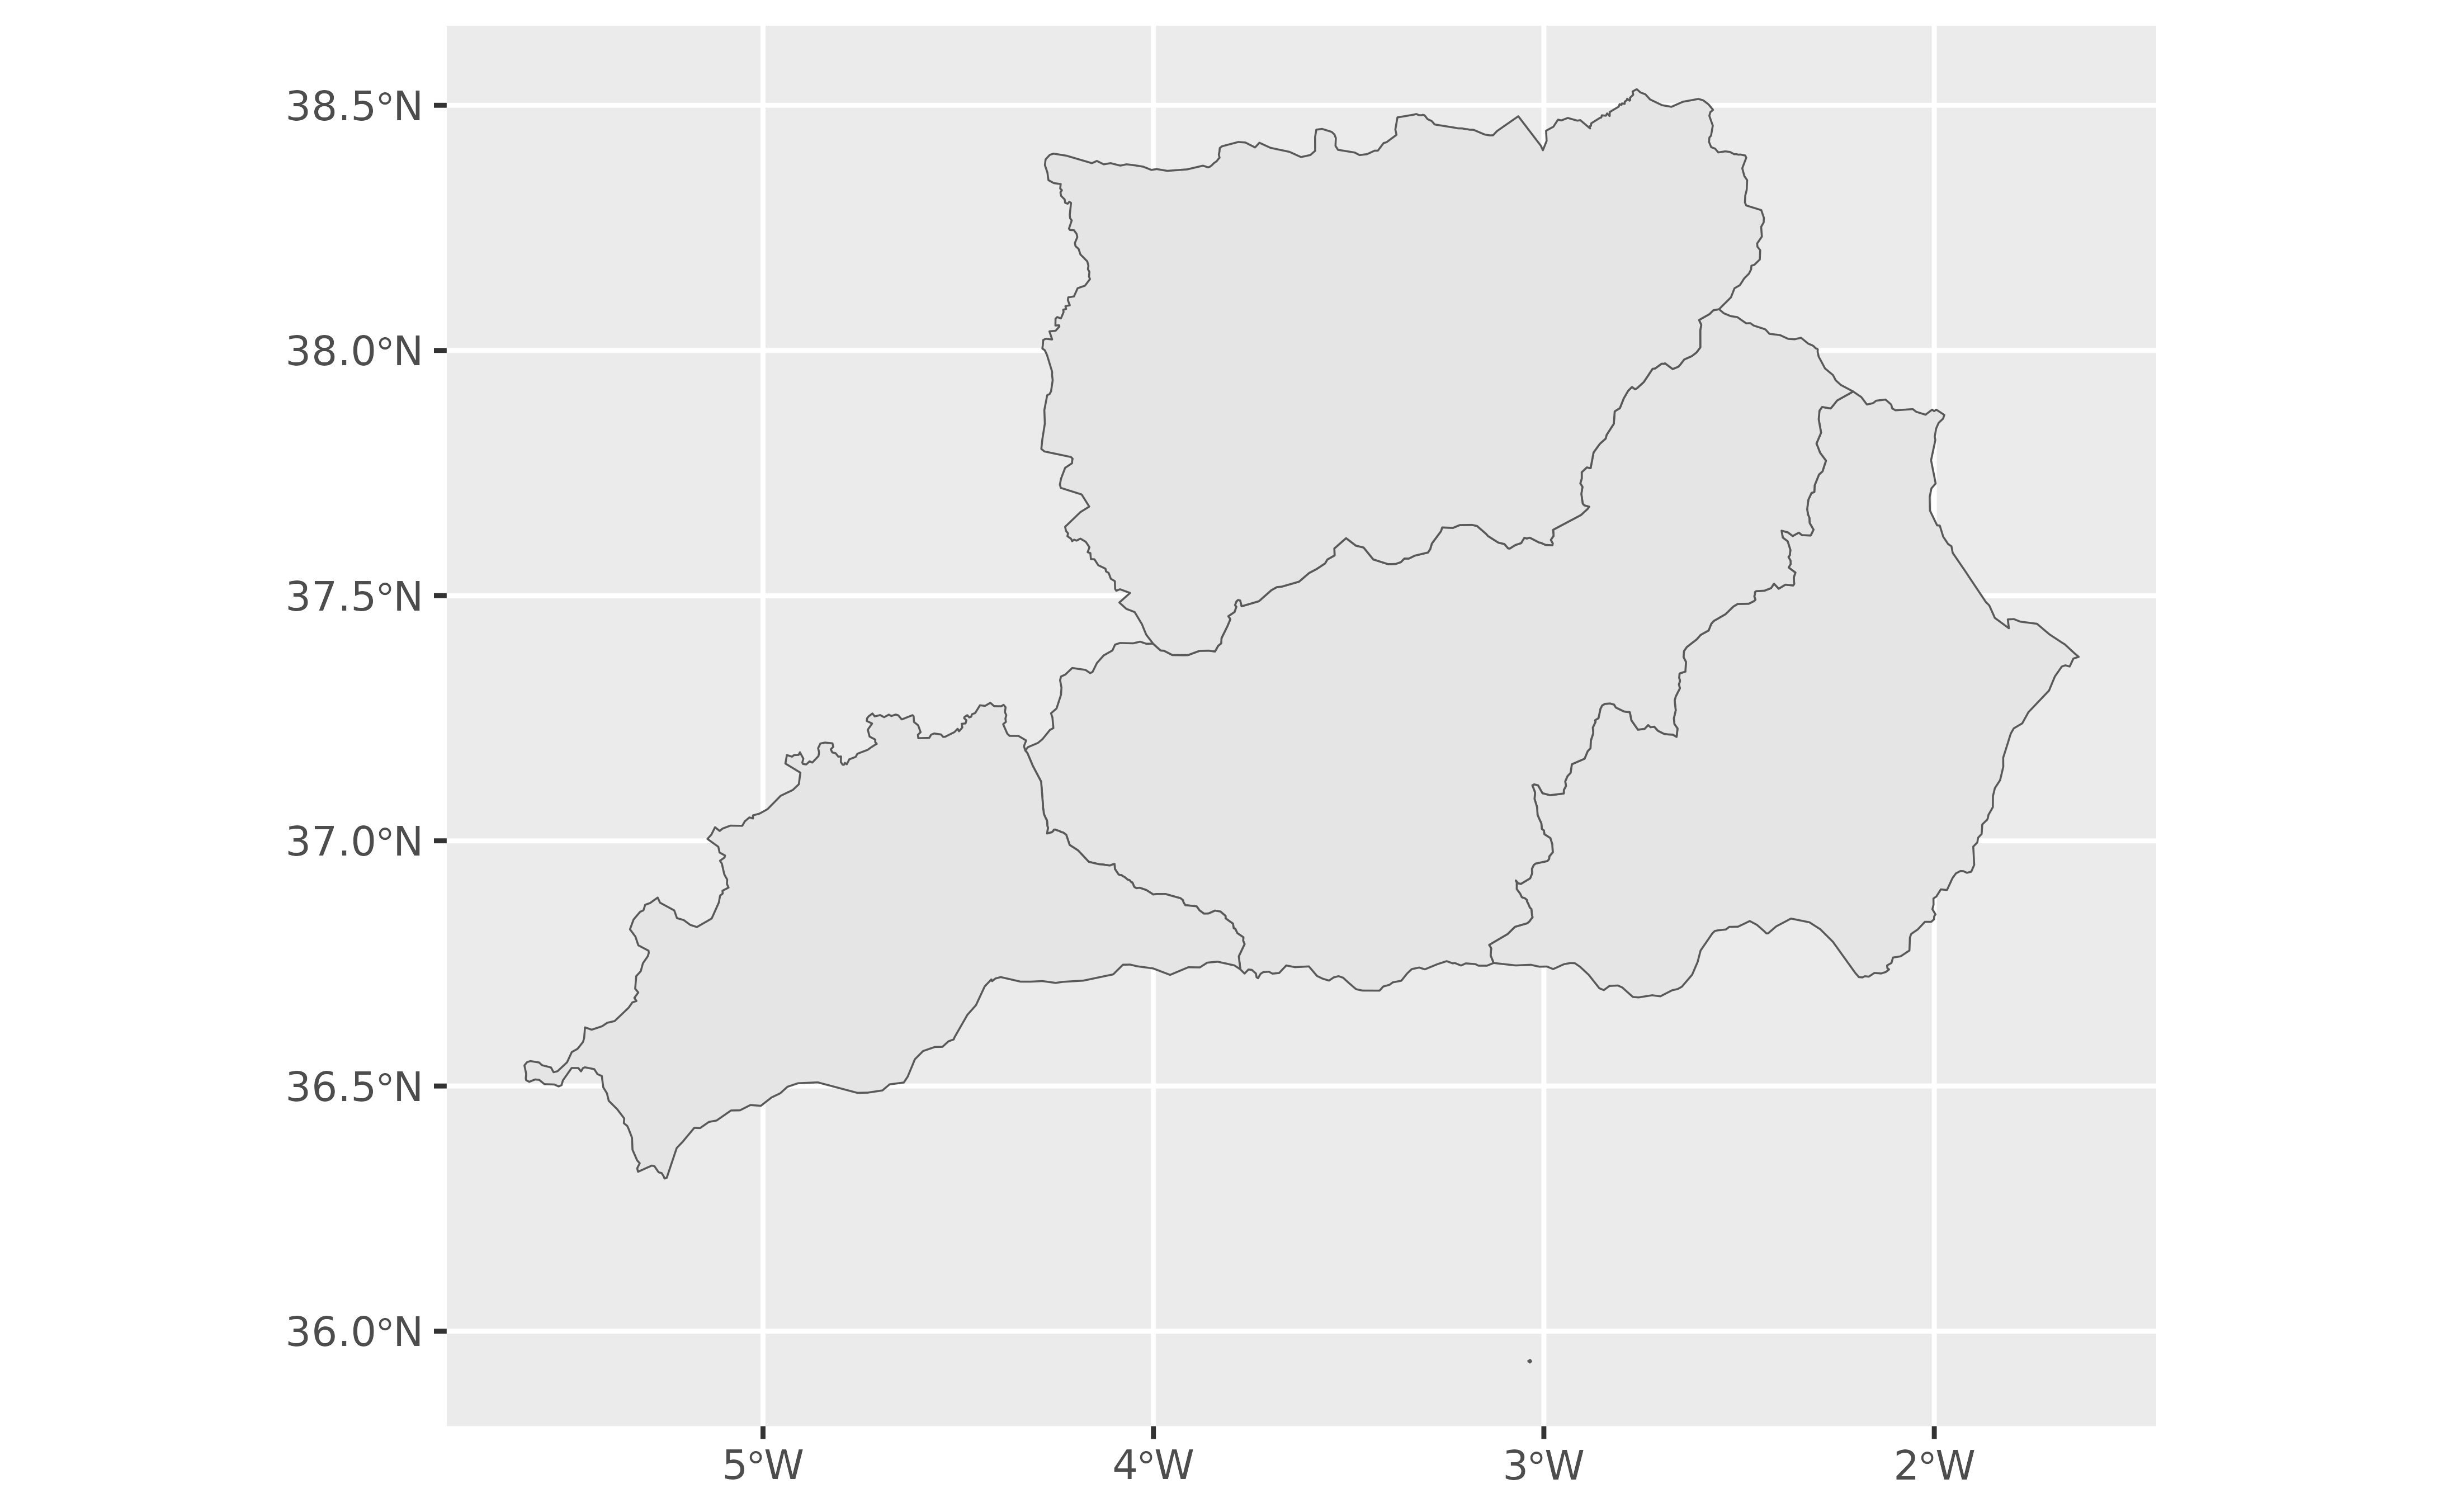
 and_orient <- esp_get_nuts(region = c(
"Almeria", "Granada",
"Jaen", "Malaga"
))
ggplot(and_orient) +
geom_sf()
and_orient <- esp_get_nuts(region = c(
"Almeria", "Granada",
"Jaen", "Malaga"
))
ggplot(and_orient) +
geom_sf()
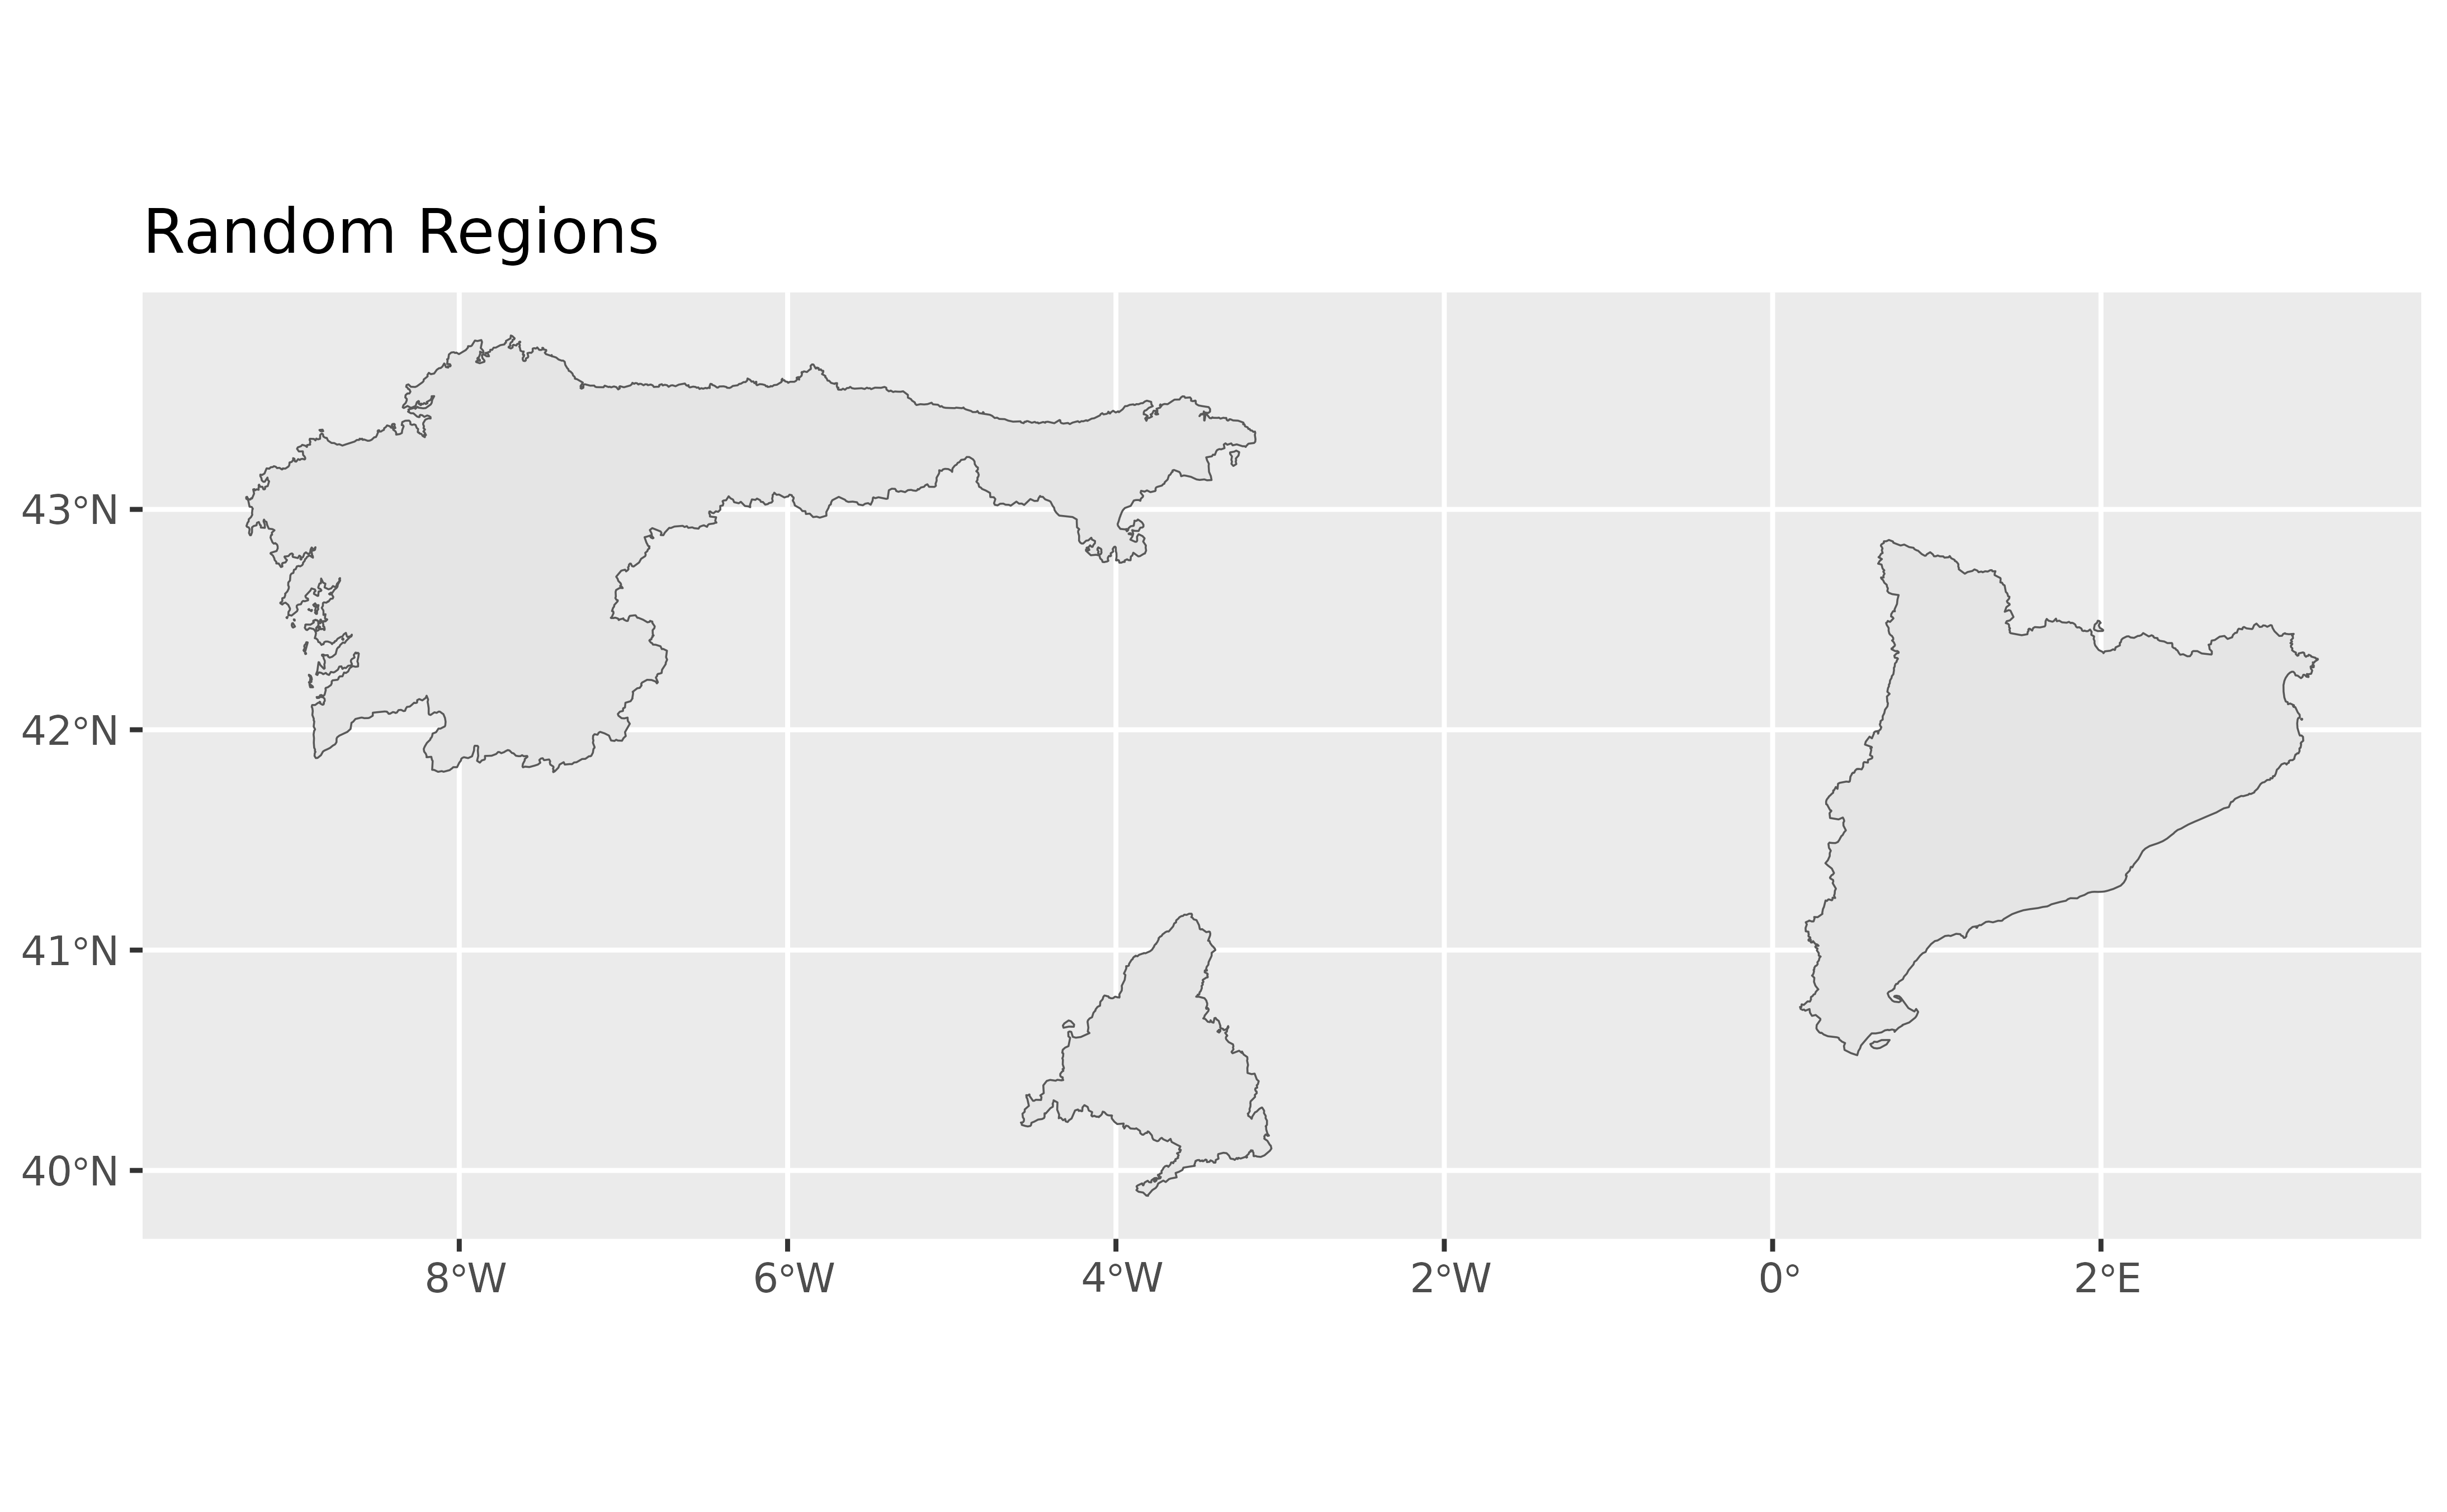
 random_regions <- esp_get_nuts(region = c("ES1", "ES300", "ES51"))
ggplot(random_regions) +
geom_sf() +
labs(title = "Random Regions")
random_regions <- esp_get_nuts(region = c("ES1", "ES300", "ES51"))
ggplot(random_regions) +
geom_sf() +
labs(title = "Random Regions")
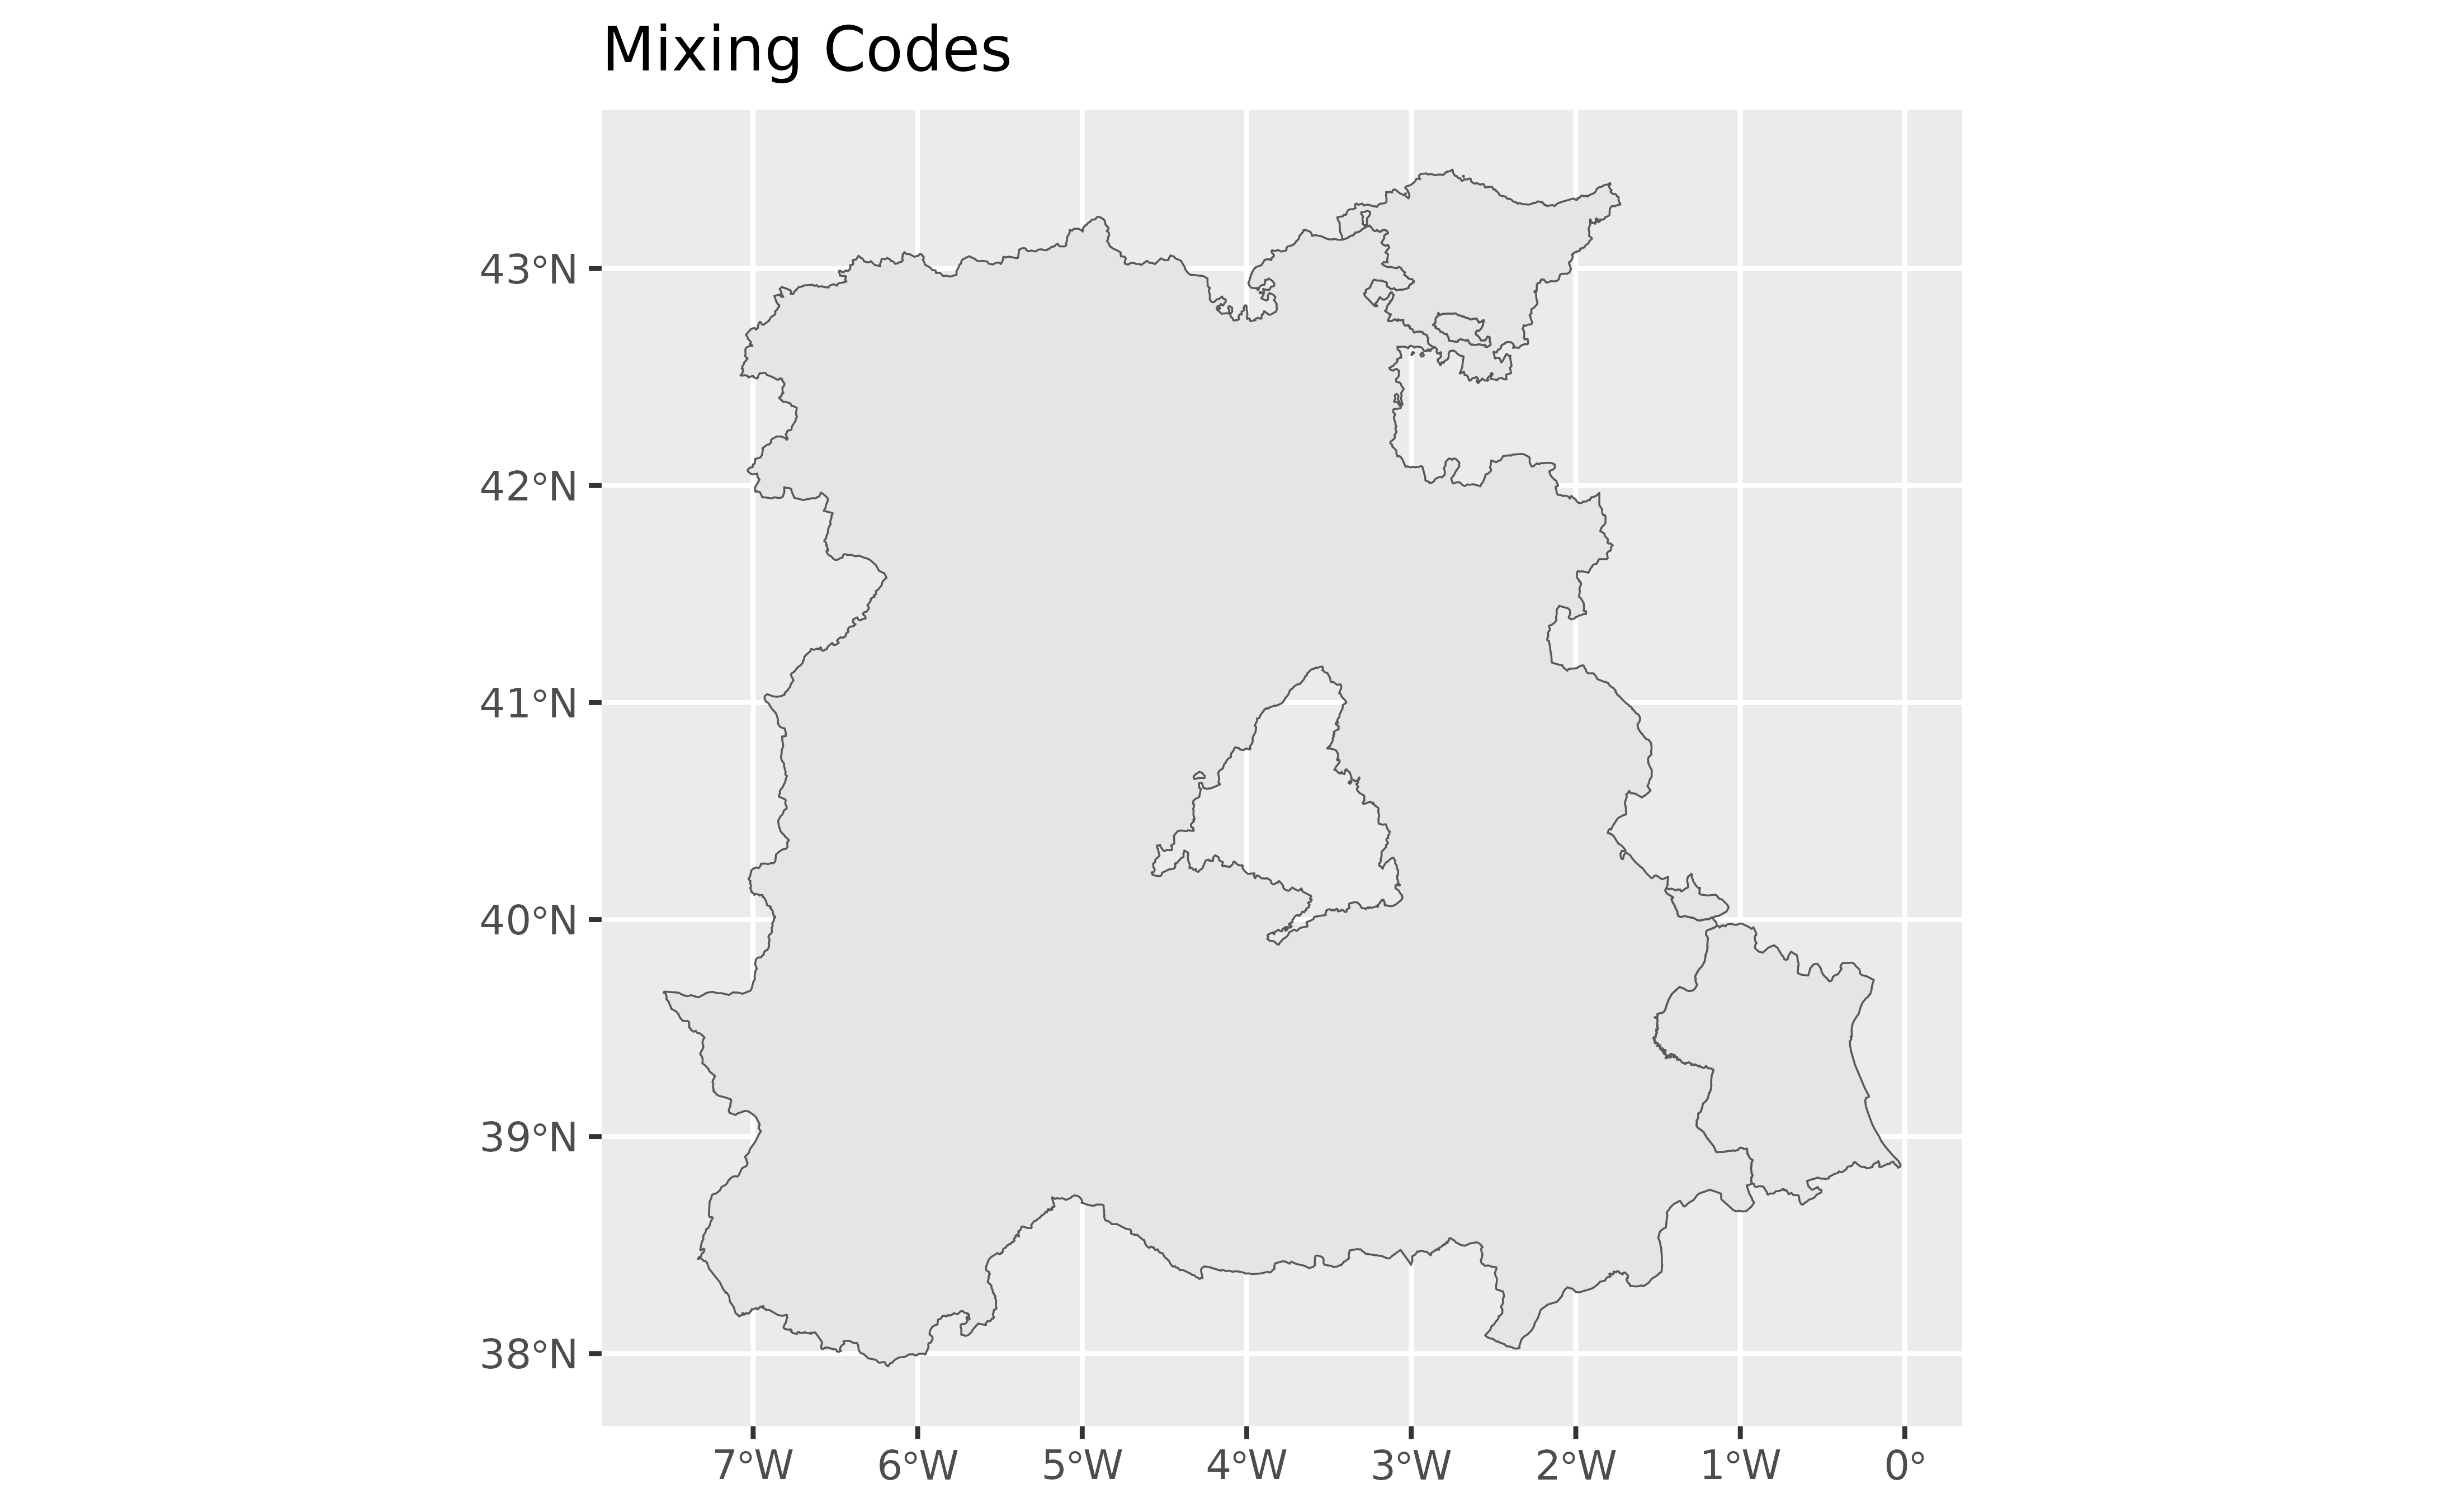
 mixing_codes <- esp_get_nuts(region = c("ES4", "ES-PV", "Valencia"))
ggplot(mixing_codes) +
geom_sf() +
labs(title = "Mixing Codes")
mixing_codes <- esp_get_nuts(region = c("ES4", "ES-PV", "Valencia"))
ggplot(mixing_codes) +
geom_sf() +
labs(title = "Mixing Codes")