Using infoelectoral to make electoral maps
municipios.RmdInstall and load the packages
Install infoelectoral and load the packages needed.
Download the results
Download some results. In this case we download the election for Congress of December 2015.
results <- municipios("congreso", "2015", "12") # Descargo los datosImport the geometries
Import the geometry shapes for the municipalities using mapSpain.
library(mapSpain)
shp <- esp_get_munic_siane(year = "2016") %>% select(LAU_CODE)
shp_ccaa <- mapSpain::esp_get_ccaa_siane()
Recode party names
Since most parties have different names throughout the country, you
will need to recode them to group their results. You can use the column
codigo_partido_nacional included in the resulting
data.frame that indicates the grouping party code at the
national level. After that you’ll have to create the complete
municipality code (LAU_CODE) for the merge with the
sf object and transform the data from long to wide
format.
First, let’s group the parties by
codigo_partido_nacional and siglas and sum the
votes to see which party codes correspond to the main parties.
results %>%
  group_by(codigo_partido_nacional) %>%
  summarise(
    siglas_r = paste(unique(siglas)[1], collapse = ", "),
    votos = sum(votos)
  ) %>%
  arrange(-votos)
## # A tibble: 56 × 3
## codigo_partido_nacional siglas_r votos
## <chr> <chr> <dbl>
## 1 903316 PP 7216024
## 2 903484 PSOE 5530428
## 3 901079 C´s 3500063
## 4 903736 PODEMOS 3182256
## 5 905033 EN COMÚ 927053
## 6 904850 IULV-CA,UPe 923377
## 7 905008 PODEMOS-COM 671077
## 8 905063 ERC-CATSÍ 599375
## 9 904991 DL 565742
## 10 905041 PODEMOS-En 408417
## # ℹ 46 more rowsThen, we’ll have to recode the party names and calculate the percentage of votes.
results <-
  results %>%
  mutate(
    siglas_r = case_when(
      codigo_partido_nacional == "903316" ~ "PP",
      codigo_partido_nacional == "903484" ~ "PSOE",
      codigo_partido_nacional == "901079" ~ "Cs",
      codigo_partido_nacional %in% c("903736", "905033", "905008", "905041") ~ "Podemos",
      codigo_partido_nacional == "904850" ~ "IU"
    ),
    # Construyo la columna que identifica al municipio (LAU_CODE)
    LAU_CODE = paste0(codigo_provincia, codigo_municipio),
    # Calculo el % sobre censo
    pct = round((votos / censo_ine) * 100, 2)
  ) %>%
  filter(!is.na(siglas_r)) %>%
  # Selecciono las columnas necesarias
  select(codigo_ccaa, LAU_CODE, siglas_r, censo_ine, votos_candidaturas, pct)
Join data and sf object
With the LAU_CODE column merge the data with the
geometries of the municipalities.
shp <- left_join(shp, results, by = "LAU_CODE")Visualize
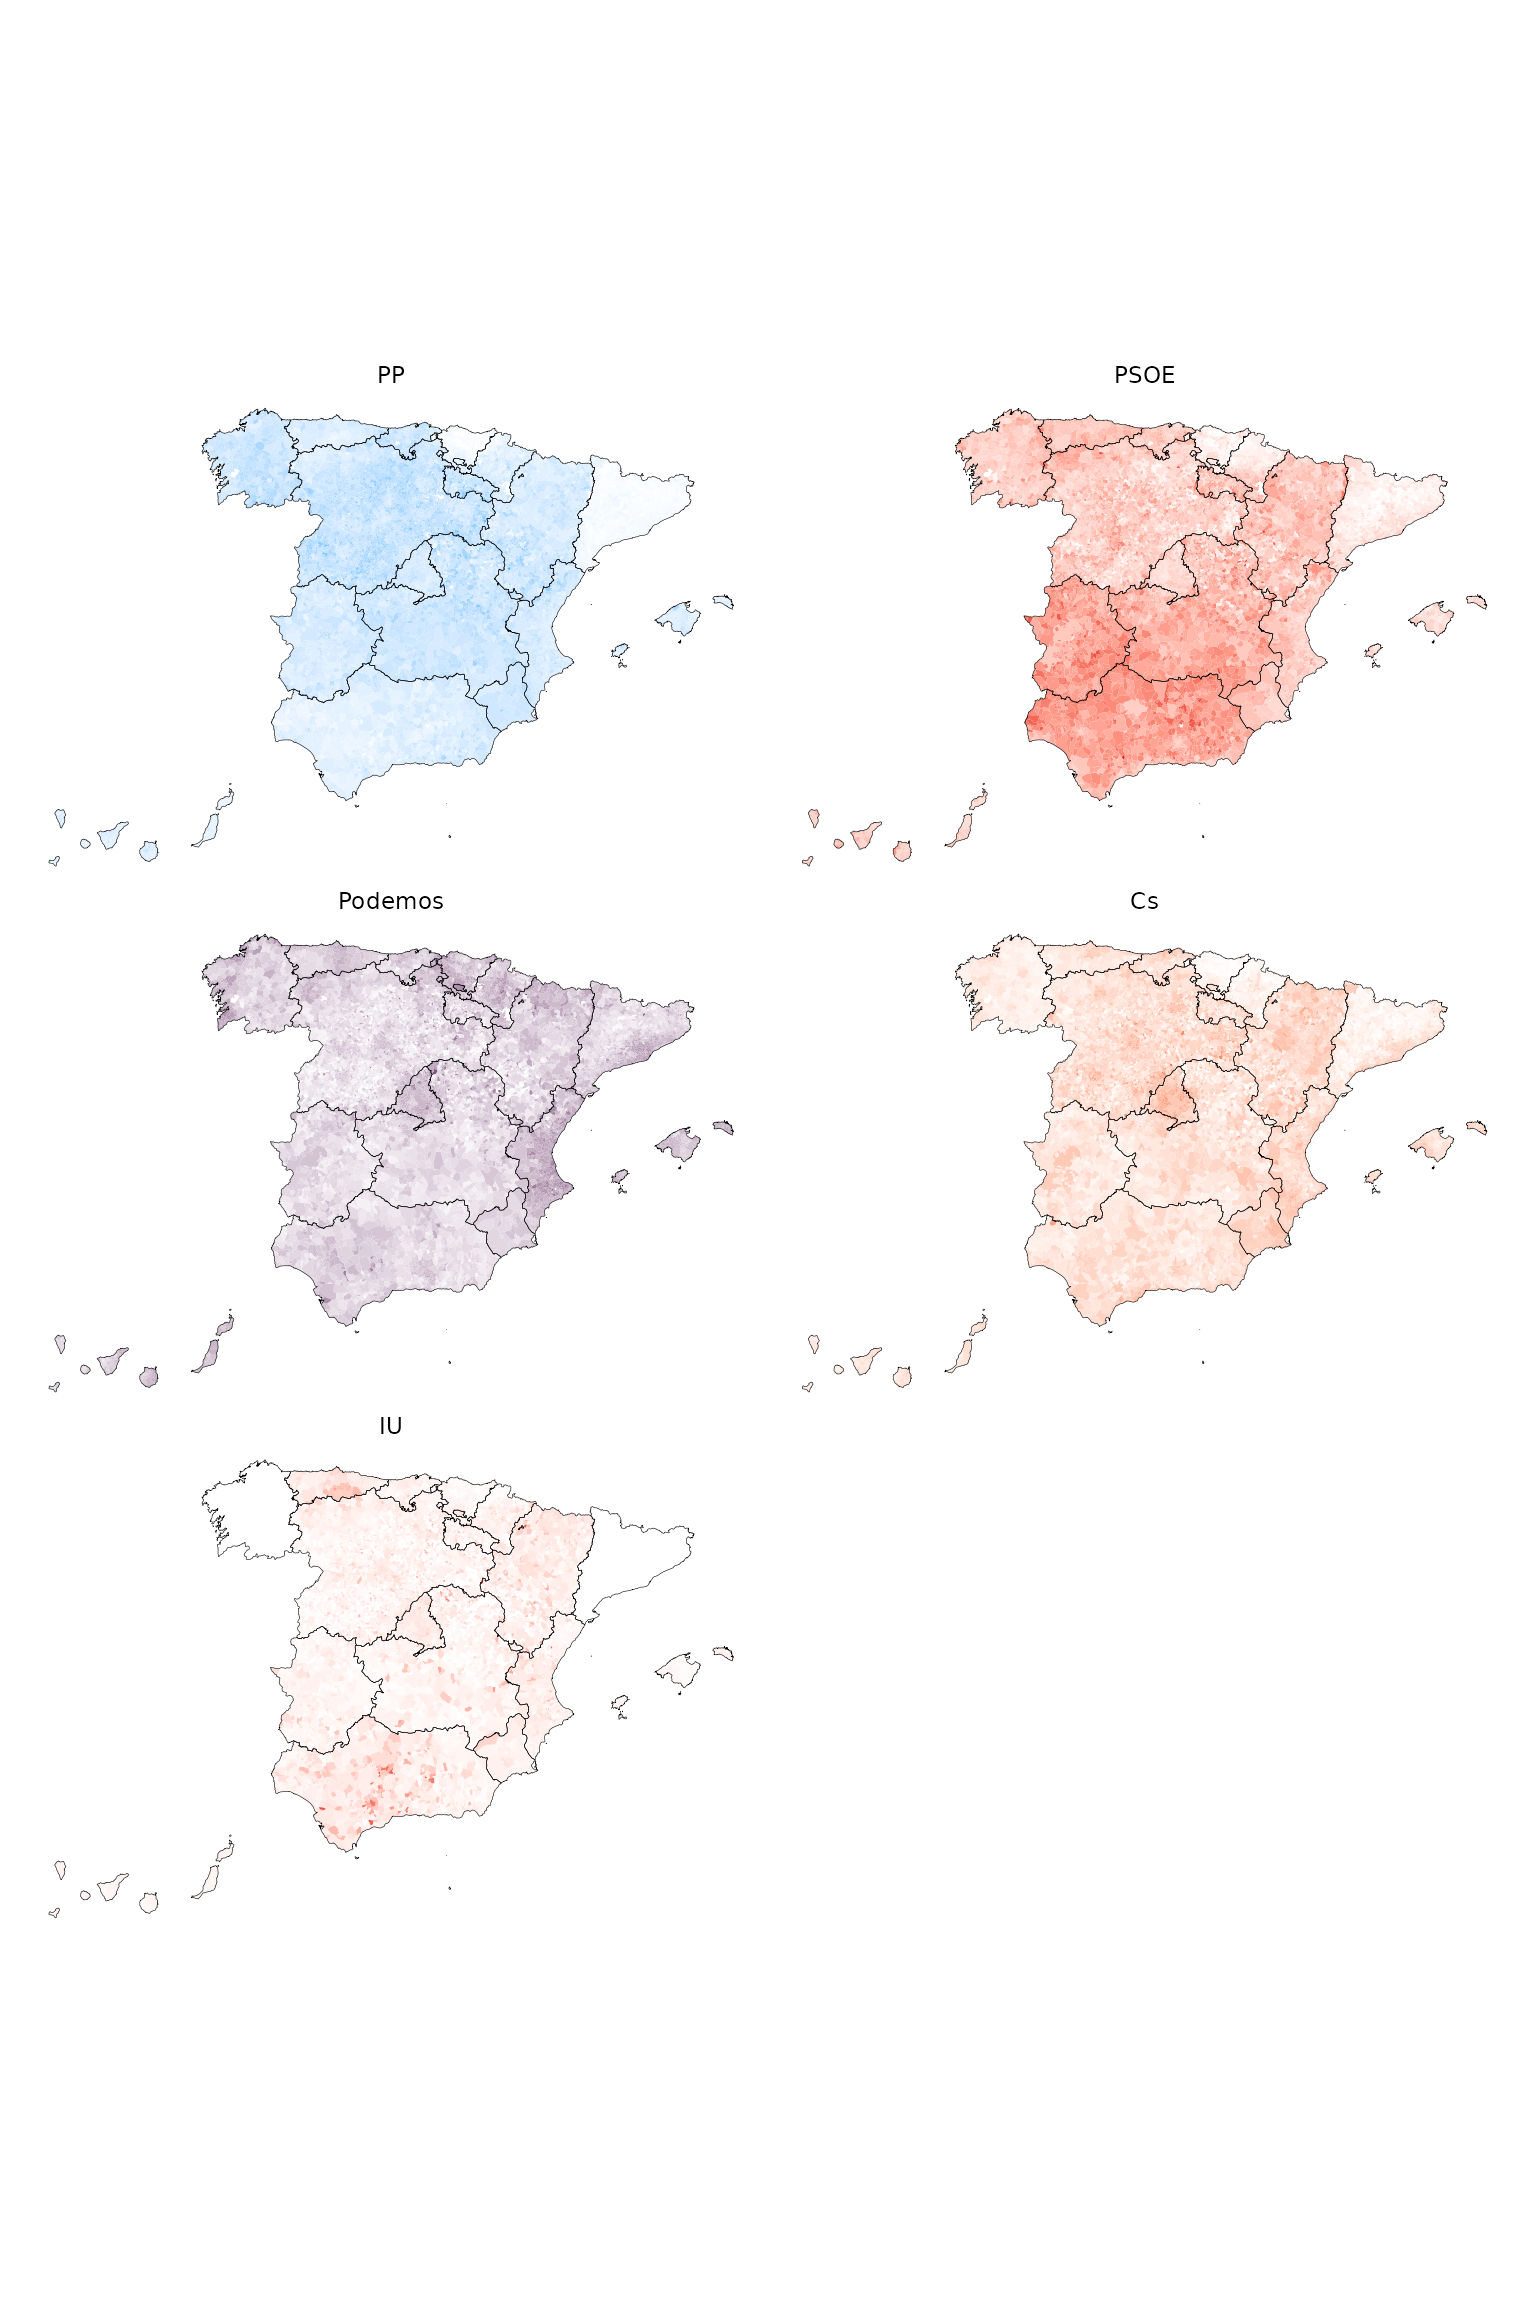
At last, we may use ggplot2 to visualize the data.
In this case we use purrr::map to create a list of plots
each of them with their own color gradient scale and
patchwork to show them together.
library(ggplot2)
library(purrr)
library(patchwork)

colores <- c("#0cb2ff", "#E01021", "#612d62", "#E85B2D", "#E01021")
names(colores) <- c("PP", "PSOE", "Podemos", "Cs", "IU")

# Creo una lista de plots
maps <-
  map(names(colores), function(p) {
    shp %>%
      filter(siglas_r == p) %>%
      ggplot() +
      geom_sf(
        aes(fill = pct, color = pct),
        linewidth = 0, show.legend = F
      ) +
      geom_sf(
        data = shp_ccaa, fill = NA, color = "black",
        linewidth = 0.1
      ) +
      facet_wrap(~siglas_r) +
      scale_fill_gradient(
        low = "white", high = colores[p],
        na.value = "grey90", aesthetics = c("fill", "color")
      ) +
      theme_void()
  })


# Uso patchworks para mostrar los plots
wrap_plots(maps, ncol = 2)