This function loads an sf LINESTRING or POINT object
representing the nodes and railway lines of Spain.
Source
CartoBase ANE (Atlas Nacional de España) provided by Instituto Geográfico Nacional (IGN), http://www.ign.es/web/ign/portal. Years available are 2005 up to today.
Copyright: https://centrodedescargas.cnig.es/CentroDescargas/cartobase-ane
Always acknowledge authorship using the following statements:
When the original digital product is not modified or altered, use one of the following statements:
CartoBase ANE 2006-2024 CC-BY 4.0 ign.es.
CartoBase ANE 2006-2024 CC-BY 4.0 Instituto Geográfico Nacional.
When a new product is generated:
Obra derivada de CartoBase ANE 2006-2024 CC-BY 4.0 ign.es.
Data distributed through the sianedata data branch, see
https://github.com/rOpenSpain/mapSpain/tree/sianedata.
Arguments
- year
Ignored.
- epsg
Character string or number. Projection of the map: 4-digit EPSG code. One of:
"4258": ETRS89."4326": WGS84."3035": ETRS89 / ETRS-LAEA."3857": Pseudo-Mercator.
- cache
Logical. Whether to cache downloaded files. Defaults to
TRUE. See Caching.- update_cache
Logical. If
TRUE, refreshes the cached file and forces a new download. Defaults toFALSE.- cache_dir
Character string. A path to a cache directory. See Caching.
- verbose
A logical value. If
TRUEdisplays informational messages.- spatialtype
![[Deprecated]](figures/lifecycle-deprecated.svg) character string.
Use
character string.
Use esp_get_stations()instead of"point"for stations.
Value
A sf object.
Caching
Functions that download data store files in cache_dir. When cache_dir
is NULL, they use the active package cache, which defaults to a temporary
directory. Set update_cache = TRUE to replace an existing cached file.
See Caching strategies in esp_set_cache_dir() to configure a
persistent cache.
See also
Transport infrastructure datasets:
esp_get_roads()
Examples
# \donttest{
provs <- esp_get_prov()
ccaa <- esp_get_ccaa()
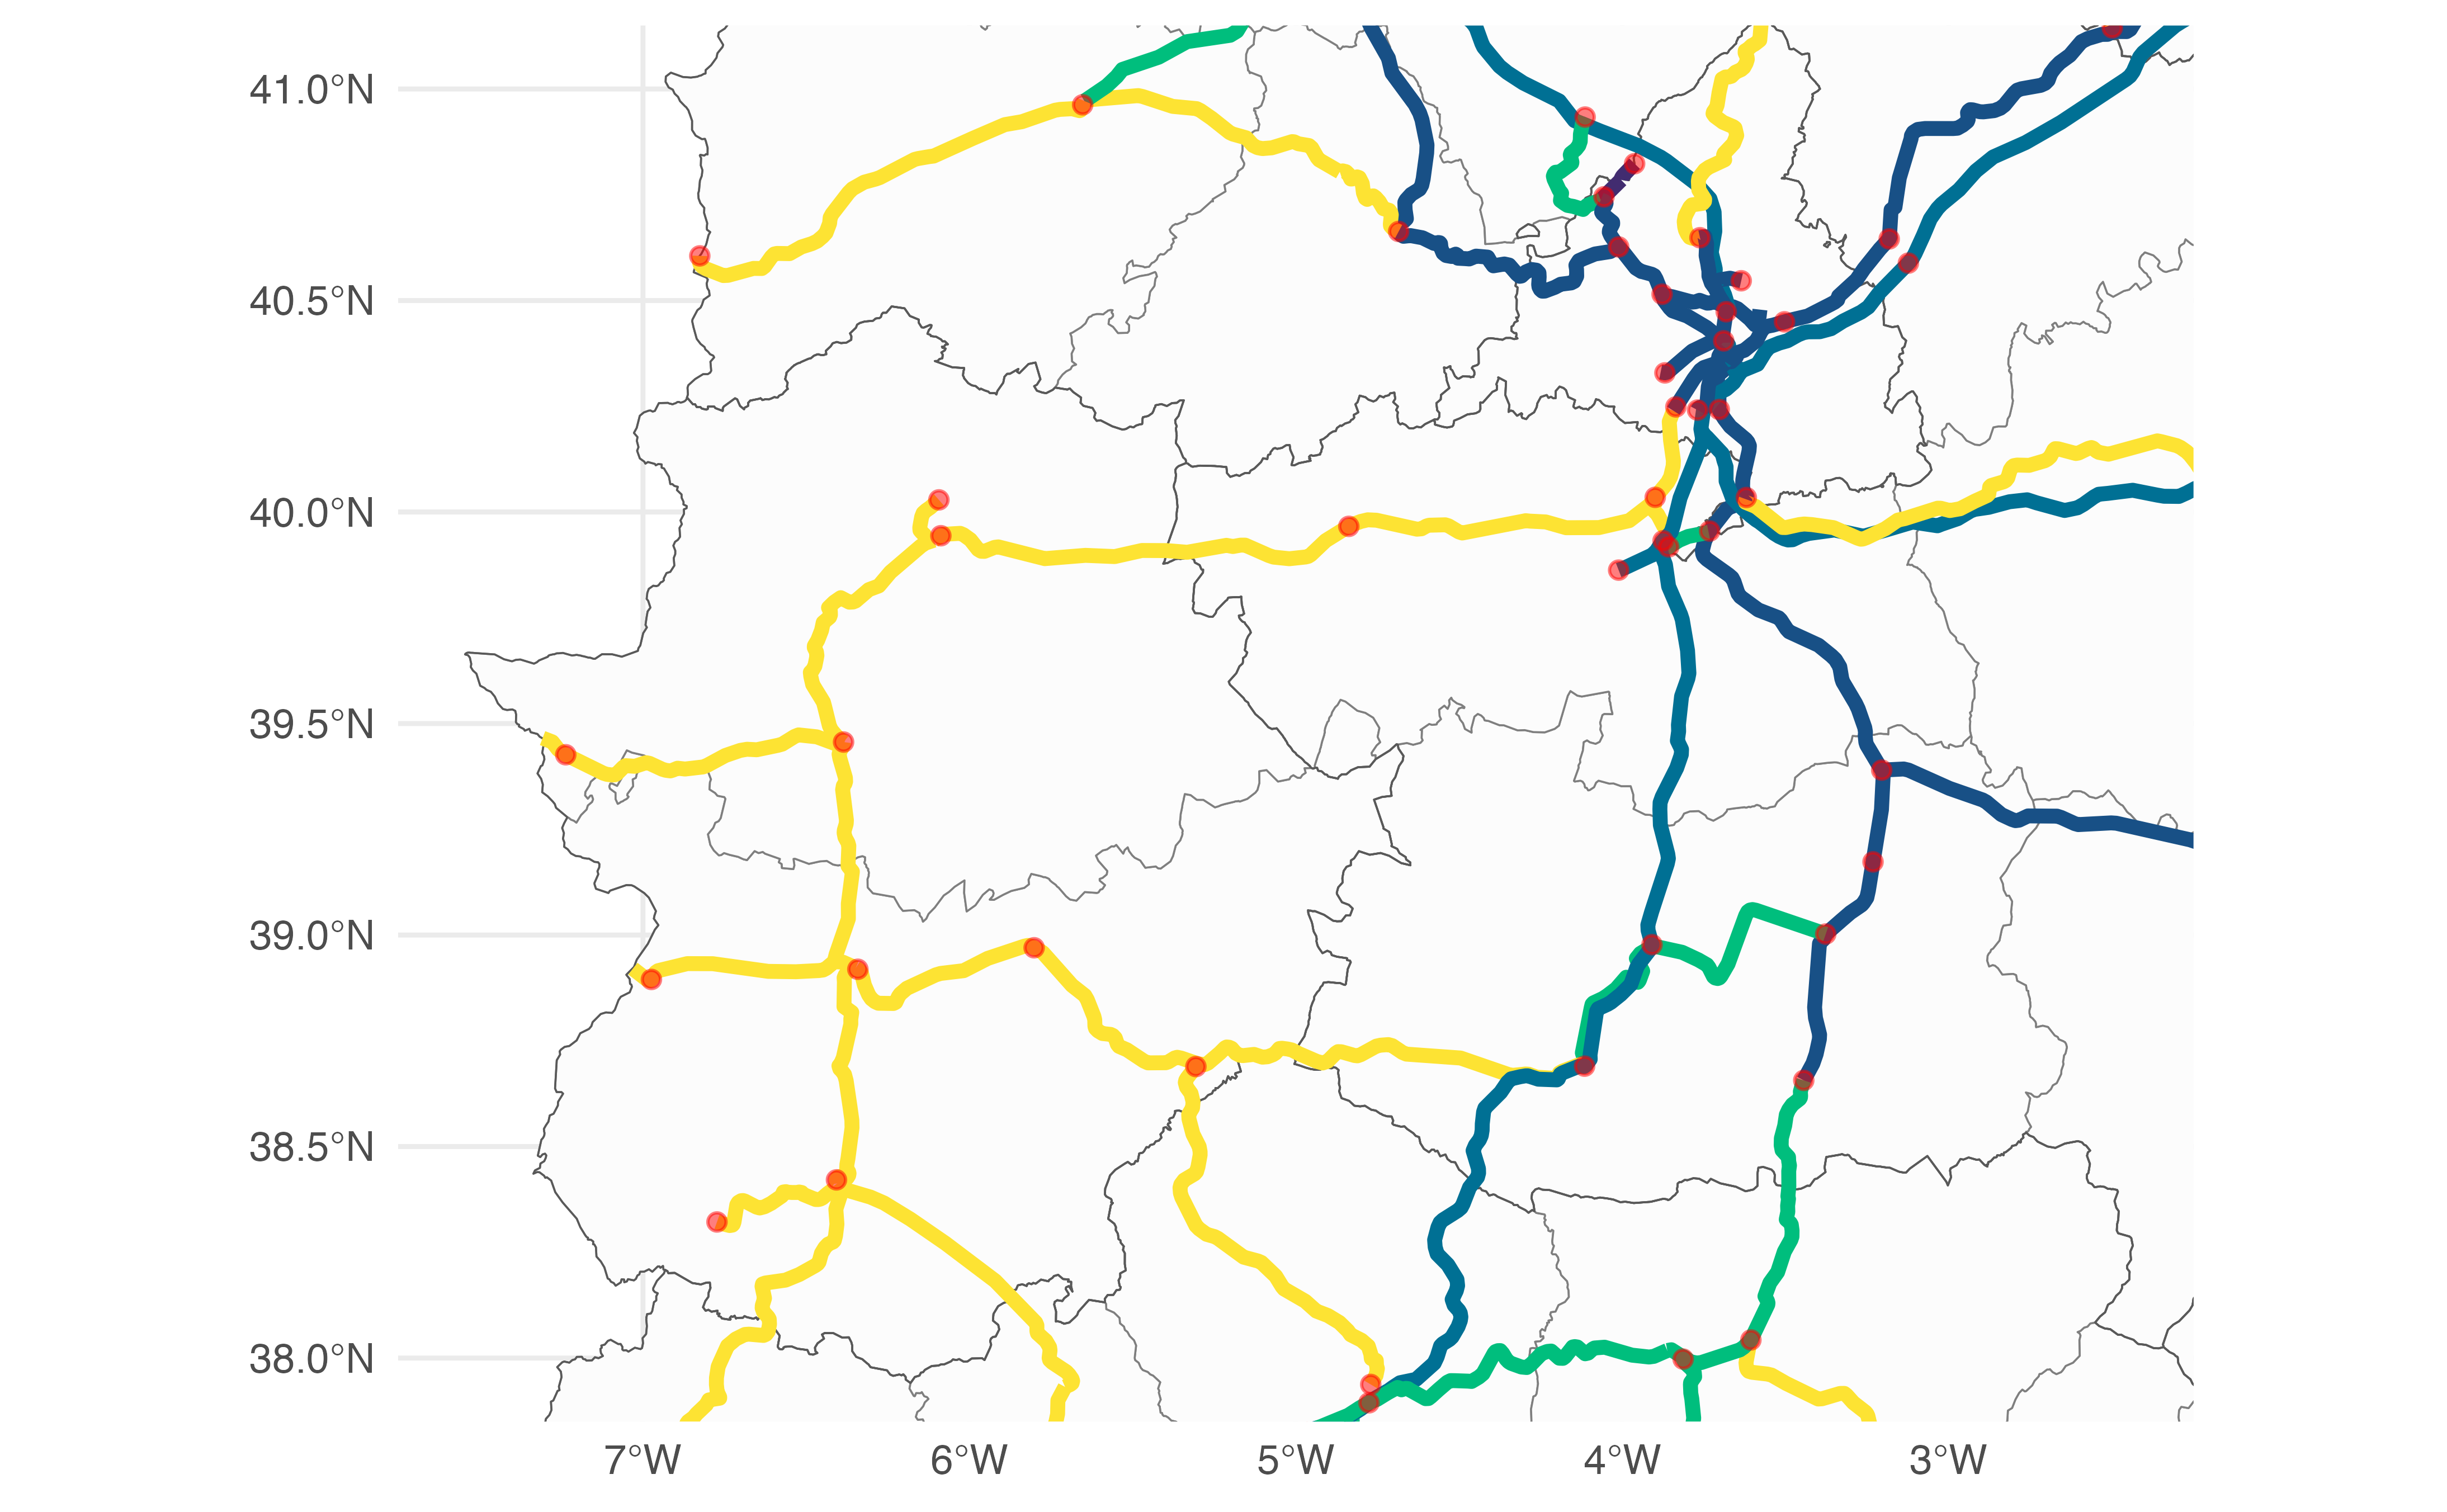
# Railways.
rails <- esp_get_railway()
# Stations.
stations <- esp_get_stations()
# Map.
library(ggplot2)
ggplot(provs) +
geom_sf(fill = "grey99", color = "grey50") +
geom_sf(data = ccaa, fill = NA) +
geom_sf(
data = rails, aes(color = t_ffcc_desc),
show.legend = FALSE,
linewidth = 1.5
) +
geom_sf(
data = stations,
color = "red", alpha = 0.5
) +
scale_colour_viridis_d() +
facet_wrap(~t_ffcc_desc) +
theme_minimal()
 # }
# }