
Example of a ggplot2 image.
library(ggplot2)

# Count rows or sums of weights.
g <- ggplot(mpg, aes(class))
# Number of cars in each class.
g + geom_bar()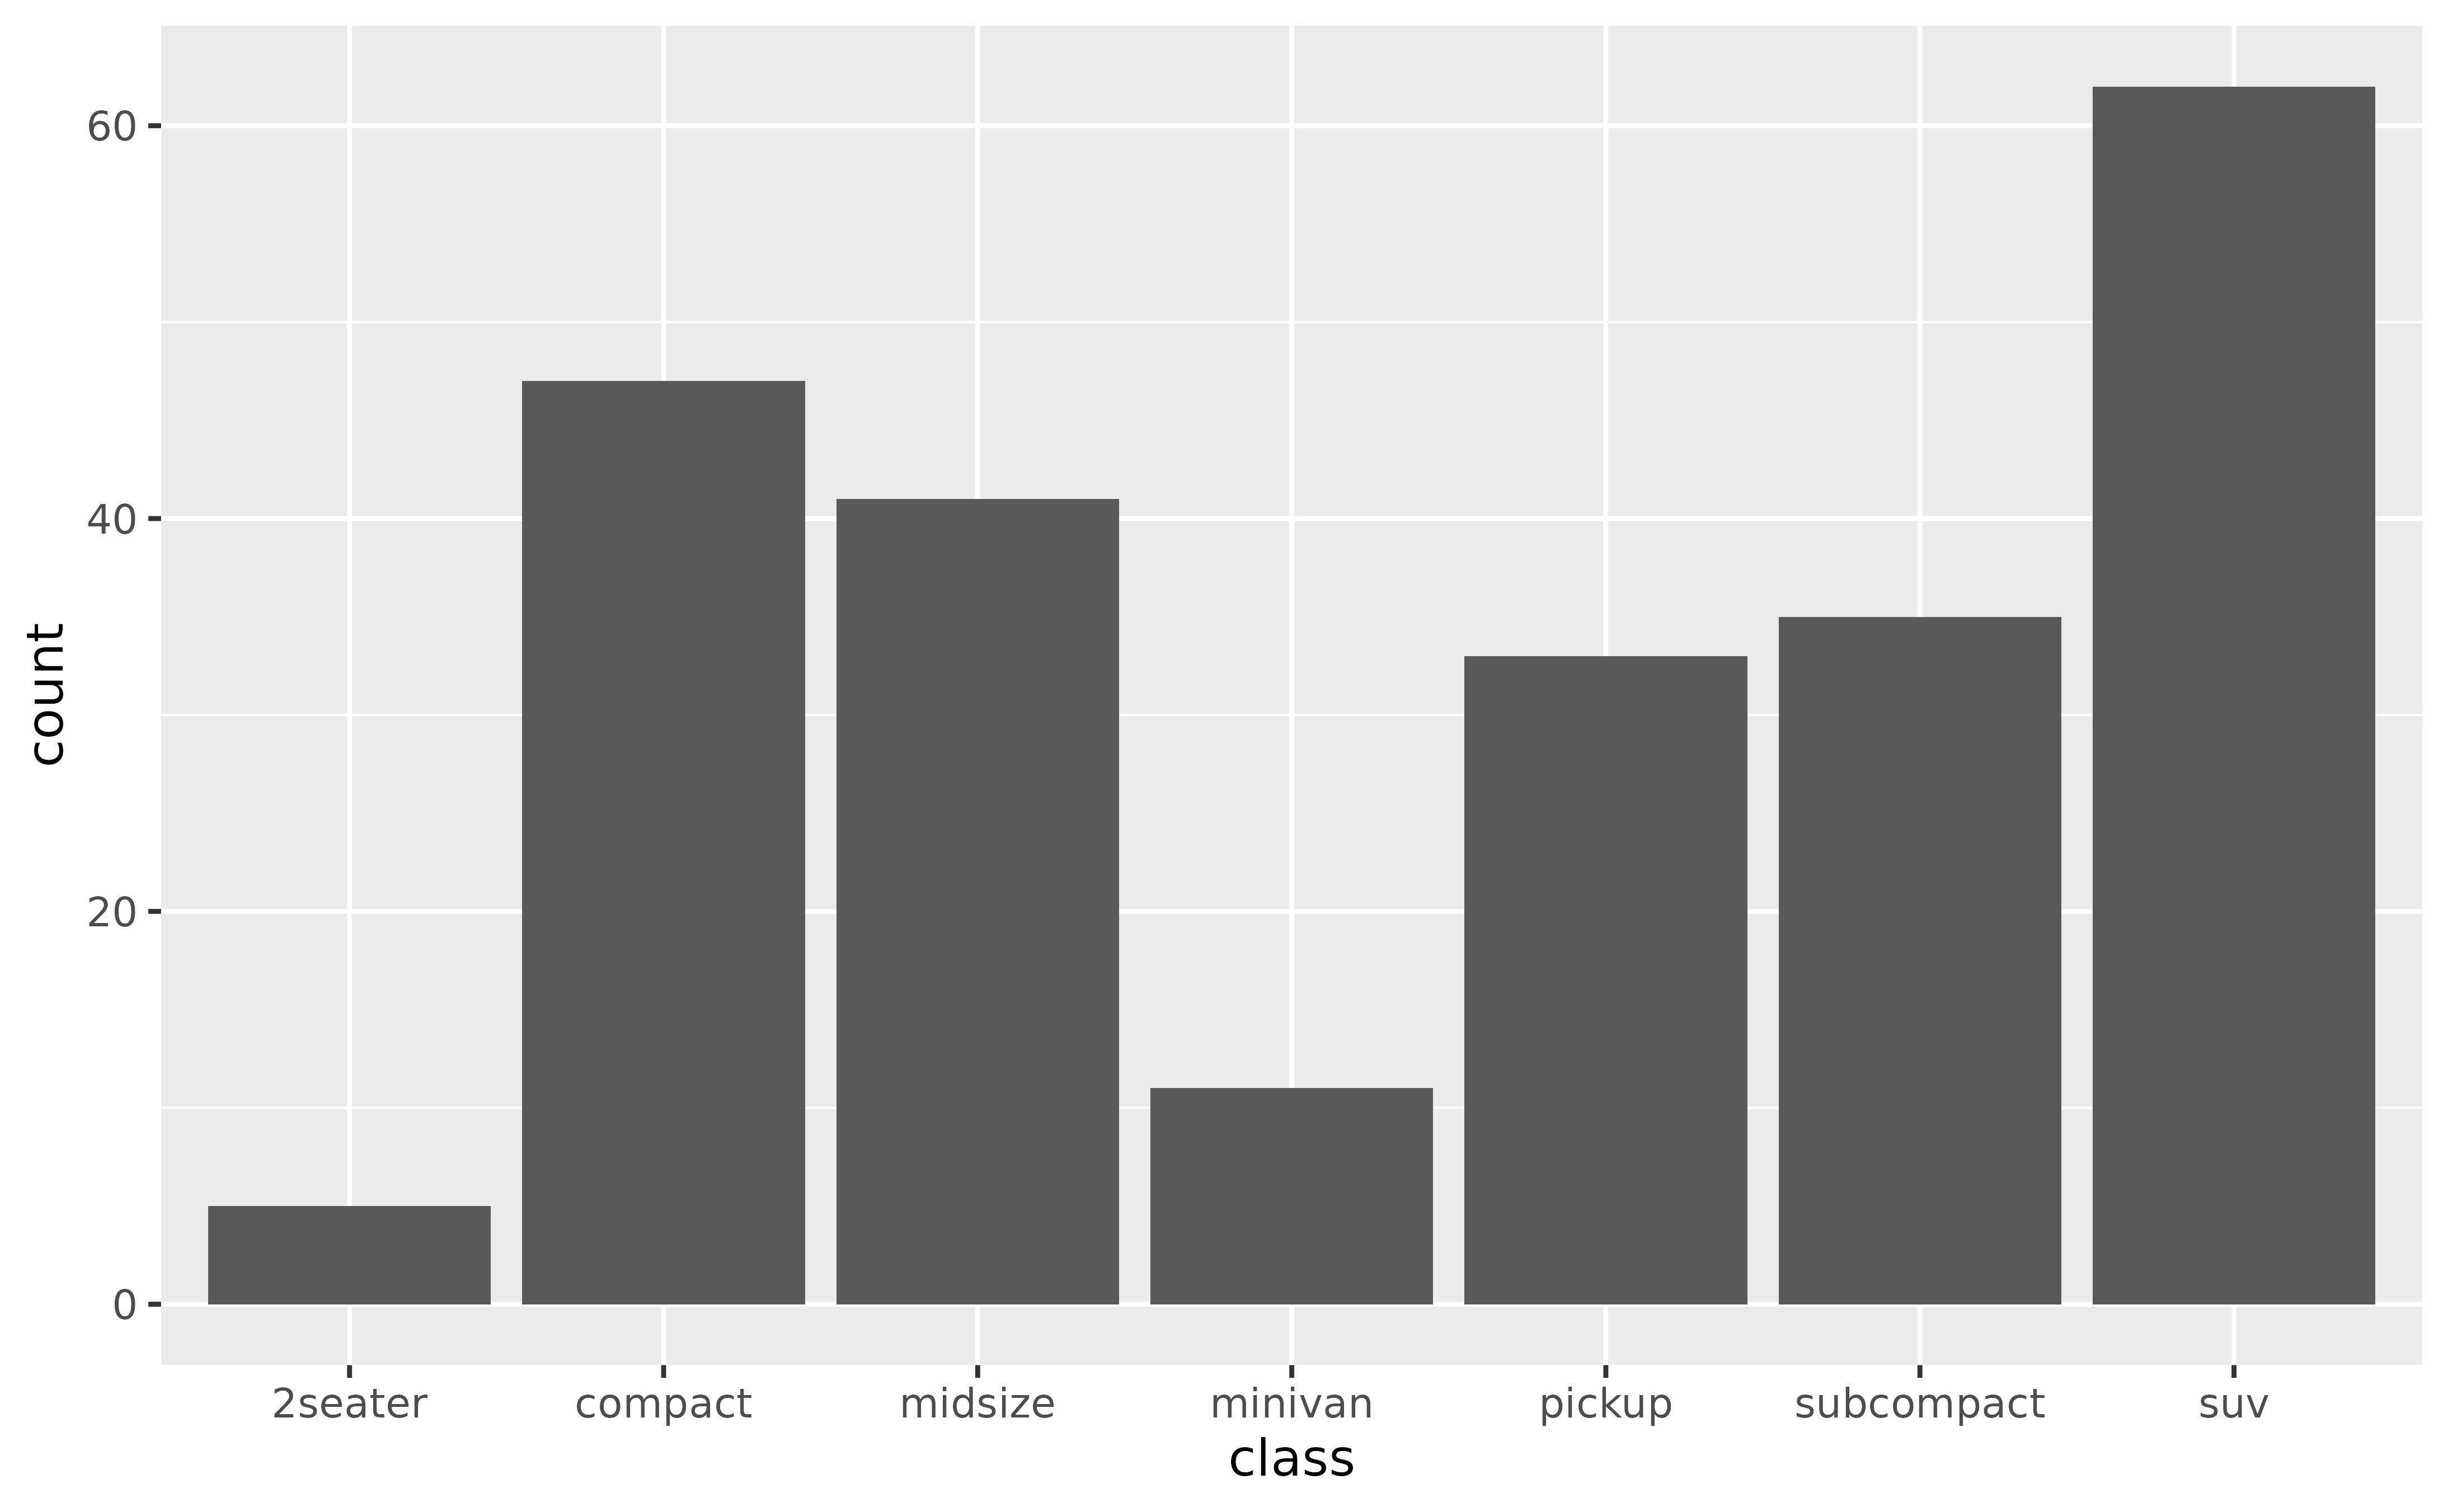
A ggplot2 image
Sitio creado con pkgdown 2.2.1.
Template rostemplate by dieghernan, based on Universal Theme for Hugo.